



Voices behind walking the talk: Quantified qualitative insights on D&I policy support reasoning

ORCID logo, ORCID logo, & ORCID logo

Received: June 30, 2025. Accepted: December 22, 2025. Published: January 13, 2026. https://doi.org/10.56296/aip00050 · © 2026 The Author(s)

Author Details

: Organizational Behavior Group, Utrecht University, Utrecht, Netherlands

: Organizational Behavior Group, Utrecht University, Utrecht, Netherlands; Institute of Psychology, Leiden University, Leiden, Netherlands

: Organizational Behavior Group, Utrecht University, Utrecht, Netherlands

*Please address correspondence to Yonn N. A. Bokern, y.n.a.bokern@uu.nl, Organizational Behavior Group, Utrecht University, Heidelberglaan 1, 3584 CH Utrecht, the Netherlands

Transparent Peer Review

The present article passed two rounds of double-blind peer review. The peer-review report can be accessed here.

Ask AI Beta

Ask a question about this article — the answer is generated from the article’s own text only.

AI-generated from this article’s text, without human review · may contain errors — verify against the article · not medical, psychological, or professional advice · Terms

Abstract

Effective Diversity and Inclusion (D&I) policy depends on both attitudinal endorsement and behavioral enactment. Yet little is known about why individuals support or fail to support D&I policy in either domain. Based on survey data from 2,639 employees in a Dutch organization, we employed k-means clustering to identify five D&I policy support profiles: Champions and Opponents (supportive or resistant in both attitude and behavior), along with three more nuanced groups—Ambivalents (ambivalent in both domains), Bystanders (attitudinally supportive but behaviorally passive), and Reluctants (behaviorally engaged but attitudinally skeptical). To examine underlying reasoning, we applied a mixed-method approach combining qualitative content analysis and Latent Class Analysis. Five distinct reasoning patterns emerged. Mapping these onto support profiles revealed that Champions and Bystanders often expressed ideological endorsement of D&I, while Reluctants voiced critical yet constructive concerns about policy implementation. Opponents expressed meritocratic beliefs or policy unawareness, and Ambivalents reported policy unawareness or inaccessibility. We additionally examined whether these patterns varied across organizational positions (managers vs. employees) and group membership (minority vs. majority). This integrative analysis demonstrates that D&I policy support and resistance are multidimensional and grounded in diverse rationales. Our findings underscore the importance of tailored strategies that address diverse motives behind support, resistance, disengagement, ambivalence, and reluctant compliance.
Editor Curated

Key Takeaways

  • Support for D&I policy is multidimensional. K-means clustering identified five profiles—Champions (13%), Bystanders (16%), Ambivalents (49%), Reluctants (9%), and Opponents (13%)—based on attitudinal versus behavioral support. Profiles were robust to adding policy awareness and showed clear differences in engagement patterns, confirming that attitudes alone do not capture implementation behavior.
  • Five reasoning patterns emerged from latent class analysis: Expressing Unawareness (29%), Reporting Inaccessibility (26%), Signaling Symbolic Support (19%), Critiquing Policy from an Advocacy Perspective (18%), and Rejecting D&I Based on Meritocratic Beliefs (9%). Reasoning patterns aligned strongly with support profiles (χ²[16, N=1,407]=573.46, p<.001, Cramér’s V=.32): e.g., Bystanders favored symbolic support, Reluctants favored advocacy-oriented critique, and Opponents showed more unawareness and meritocratic rejection.
  • Managerial and group-status differences were meaningful. Managers were overrepresented among Champions and Reluctants and underrepresented among Ambivalents and Opponents (χ²[4, N=2,638]=109.96, p<.001, Cramér’s V=.20). Perceived minority status related to more critical profiles (Reluctants, Opponents) and to advocacy-oriented critique in reasoning (clusters: χ²[4, N=2,627]=59.28, p<.001, V=.15; reasoning: χ²[4, N=1,405]=34.55, p<.001, V=.16), highlighting distinct motivational drivers across groups.

Introduction

In recent years, Diversity and Inclusion (D&I) policies—defined as organizational efforts to improve the representation, treatment, and outcomes of historically marginalized groups (Leslie, 2019)—have become increasingly prominent in organizational strategies. The murder of George Floyd in 2020, along with the resurgence of global racial justice movements, accelerated the institutionalization of such policies, positioning D&I as both a moral and strategic imperative (McKinsey & Company, 2023). Yet, as political tides shift, the pendulum is swinging back on these commitments. D&I is increasingly framed as ideologically divisive or legally contentious (Ng et al., 2025), leading some institutions to scale back or abandon their commitments.

Beyond political pressures, a more enduring challenge lies in the inconsistent implementation and uptake of D&I policies (Dobbin & Kalev, 2022; Nishii et al., 2018). While some organizations report positive outcomes, many struggle to translate D&I policies into meaningful change, often encountering backlash, disengagement, or limited improvements for disadvantaged groups (Dobbin & Kalev, 2016). These mixed results underscore Strategic Human Resource Management (SHRM) scholars’ critique of prevailing “black box” approaches, which implicitly assume that policy design alone will produce desired outcomes (Armenakis & Bedeian, 1999; Bowen & Ostroff, 2004; Wright & Nishii, 2013). Instead, the process model of SHRM highlights that policy effectiveness also requires attention to intermediate steps: not only the policies as intended, but also how they are implemented, perceived by employees, and responded to by employees, which ultimately shape organizational outcomes (Nishii & Wright, 2008, see Figure 1). In this research, we focus on D&I policy support from both managers and employees, as the glue that holds this chain together and a potential breakpoint within it.

Psychology of PushbackPart of a Special IssuePsychology of PushbackThis article belongs to a curated special issue. Discover more research on this topic from the full collection.Explore the special issue →

Effective implementation requires support from multiple actors within the organization (Armenakis et al., 1999). Each stage of the process—from policy intent to organizational outcomes—relies on their engagement (Wright & Nishii, 2013). Managers play a critical role by translating intended policies into actual practices, both instrumentally—by implementing policies (Bowen & Ostroff, 2004)—and symbolically—by modeling D&I as a core organizational value (Tost & Johnson, 2019). Whether these policies lead to meaningful employee reactions depends on how employees perceive and evaluate them. These perceptions are shaped by the extent to which employees see D&I policy as aligned with their values, goals, needs, and expectations (Nishii et al., 2018; Wright & Nishii, 2013). This alignment is likely to depend on employees’ group status. In particular, intergroup research shows that minoritized group members on average often view D&I policy as more self-relevant and therefore respond differently than majority-group members, who may perceive D&I policy as more distant from their own experiences or as a potential identity threat (Avery, 2011; Dover et al., 2016; Kaiser & Major, 2006; Plaut et al., 2011). Additionally, alignment may also depend on employees’ position within the organizational hierarchy, because the distinct roles and expectations attached to managerial and non-managerial positions may anchor divergent motivations for supporting D&I policy.

Although prior work has examined how people view specific diversity initiatives (e.g. Scarborough et al., 2019) or diversity as an abstract value (see Rattan & Ambady, 2013, for a review), comparatively little is known about how employees support the D&I policy of their own organization. This is a limitation, because D&I policies are more likely to be effective when they are supported by both employees and organizational leaders (Dobbin & Kalev, 2016; Dobbin et al., 2015; Kalev et al., 2006). Understanding the motivational anchors of D&I policy support among managers and employees from both majority and minority groups is therefore essential for explaining why well-intended initiatives may falter during implementation.

Figure 1

Process Model of SHRM in the Context of D&I Policy (adapted from Nishii & Wright, 2008)

Multidimensional Perspective on D&I Policy Support

Despite its presumed importance, however, little is known about the underlying motives of D&I policy support among managers and employees. Moreover, with few exceptions (Avery, 2011; Jansen et al., 2024; Kanitz et al., 2024), existing research often conceptualizes support as unidimensional—as a matter of being either for or against D&I. This binary framing underlies much of the empirical work, where support is typically measured through attitudinal self-reported measures, and resistance inferred from low endorsement scores (Blommaert & Coenders, 2024; Scarborough et al., 2019). For example, in a meta-analysis of 35 years of research, attitudes toward Affirmative Action Programs were defined as evaluative judgments ranging from staunch resistance to staunch support, nearly always assessed via self-report Likert-scales (Harrison et al., 2006). Correspondingly, research on antecedents of support or resistance has primarily focused on predicting attitudinal responses across personal (e.g., personality, values), group-based (e.g., social identity), and contextual (e.g., leadership signals, policy framing) levels (see Gündemir et al., 2024 for a review).

This approach has two key limitations. First, it often overlooks behavior. Attitudinal measures are used as proxies for engagement, yet actual behavior—such as advocating for or enacting D&I policies—may not align with expressed attitudes. This well-documented attitude–behavior gap is especially pronounced in socially sensitive and moralized domains such as D&I. In such contexts, injunctive norms and impression management concerns (e.g., the wish to be seen as a moral person) may lead individuals to voice attitudinal support without acting accordingly or irrespective of their deep-rooted attitudes (Cialdini et al., 1990; Ellemers, 2017; Tourangeau & Yan, 2007). Conversely, behavior without explicit attitudinal endorsement is also possible, for instance when individuals act out of compliance, role expectations, or because they endorse the broader aims of D&I while withholding endorsement of the specific policy (cf. Ajzen, 1991; Cialdini et al., 1990; Herscovitch & Meyer, 2002). An exclusive focus on attitudes risks misclassifying employee responses: those who report support but remain inactive may be seen as fully supportive, while those who act compliantly but express skepticism may be labeled as resisters. Such misclassification conceals the complexity of engagement and masks the distinct motivations underlying various patterns of response. Ultimately, this limits organizations’ ability to accurately assess support strength and adapt their policies accordingly.

Second, the binary focus leaves little understanding of more ambivalent or inconsistent forms of support. What motivates employees who endorse D&I in principle but remain behaviorally disengaged? Why do some enact policy despite attitudinally opposing it? And what drives ambivalence? Further complicating this is the tendency to study attitudes in isolation. As Gündemir et al. (2024) argue, responses are shaped by interactions among individual, group, and contextual forces, which must be studied together to understand policy engagement.

To address these limitations, we adopt a multidimensional perspective on D&I policy support, distinguishing between attitudinal and behavioral engagement. Attitudinal support reflects beliefs about the policy’s fairness, credibility, usefulness, and trustworthiness; self-reported behavioral support concerns whether individuals act in ways that promote the policy’s implementation (e.g., showing others that initiatives are useful, publicly declaring support, or actively contributing). Drawing on recent work (Bokern et al., 2025; Jansen et al., 2024), we classify employees into five empirically derived support profiles. Beyond the commonly recognized categories of individuals who consistently support (“Champions”) or oppose (“Opponents”) D&I policies in both attitude and behavior, this work has also identified more nuanced profiles: Ambivalents, who show ambivalence in both domains; Bystanders, who support attitudinally but remain behaviorally disengaged; and Reluctants, who comply behaviorally despite lacking attitudinal support.

Rethinking Support and Resistance: Uncovering the Underlying Motives Behind Support Profiles

Adopting this multidimensional view of support results in more nuanced D&I policy support profiles. However, it prompts the question of why employees and managers (do not) support their organization’s D&I policy in attitude and behavior. While classification helps map the landscape of support, both literature and practice benefit from understanding the motivations behind these profiles.

Rather than treating attitude–behavior discrepancies as anomalies to be explained away, our approach conceptualizes them as informative profiles in their own right. The analytical focus thus shifts from asking why attitudes and behaviors are (mis)aligned, to examining the underlying motives and needs that give rise to distinct constellations of attitudinal and behavioral support. Situating these D&I policy support profiles within existing psychological literatures highlights theoretically meaningful patterns. Construal Level Theory (CLT) provides a useful framework for anticipating divergences between attitudinal and behavioral support. CLT proposes that psychologically distant events are construed at a high, abstract level, whereas psychologically close events are construed at a low, concrete level (Trope & Liberman, 2003, 2010). Applied to D&I, research shows that diversity is generally evaluated more positively in abstract, distal terms than in concrete, proximal ones. For instance, Jaffé et al. (2019) found that diversity was endorsed as an important and desirable goal in the abstract, yet evaluations became more ambivalent when concrete implementation within one’s own team was considered. Similarly, Toma et al. (2025) demonstrated across five studies that participants expressed stronger pro-diversity attitudes and made more diversity-enhancing choices when diversity was framed abstractly (“for most companies and teams”) rather than concretely (“for my company and team”).

Intergroup research further suggests that the effects of abstract versus concrete construals may not be uniform across groups but can be shaped by social identity. Social identity theory (SIT; Tajfel & Turner, 1979) posits that individuals are motivated to maintain a positive and distinctive ingroup identity. Because D&I policies involve concrete measures aimed at reducing structural inequalities and redistributing opportunities, as well as increasing the representation, status, and power of historically disadvantaged groups (Iyer, 2022), they may be experienced by majority-group members as threatening to ingroup status, privilege, or distinctiveness. Such perceived threat can elicit defensive responses rooted in reactive distinctiveness, as individuals seek to reassert clear boundaries between “us” and “them” (Jetten et al., 2004; Kaiser & Major, 2006; Plaut et al., 2011). Accordingly, prior research shows that majority-group members tend to endorse diversity and egalitarian ideals more strongly at higher, abstract levels of construal than when these ideals are translated into concrete organizational policies (Mahfud et al., 2018; Rios & Wynn, 2016; Whitley & Webster, 2019; Yogeeswaran & Dasgupta, 2014). This pattern aligns with interest convergence and affirmative action research, which shows that dominant-group support for egalitarian principles is often conditional: abstract commitments are widely endorsed, but support becomes constrained or selectively withheld when concrete policies are perceived to conflict with ingroup interests or existing advantages (Bell, 1980; Knowles et al., 2014; Starck et al., 2024). By contrast, for many minoritized employees, concrete D&I measures are more likely to be experienced as identity-affirming and instrumentally beneficial, as they directly address barriers to inclusion, representation, and equal treatment (Dover et al., 2016; Iyer & Ryan, 2009). Thus, while abstract diversity ideals are relatively easy to endorse across groups, concrete D&I policies carry diverging implications for majority and minority members’ identity, status, and self-interest.

This literature foreshadows how divergences between attitudinal and behavioral support may arise. Bystanders may exemplify the principle–implementation gap: they might endorse diversity in abstract, distal terms (“diversity is good”) yet refrain from engaging with concrete organizational practices designed to realize this goal (Dixon et al., 2010; Trope & Liberman, 2010). Reluctants, by contrast, may engage behaviorally—perhaps due to normative or role-based expectations—while remaining skeptical about the policy itself. Such skepticism may reflect a concrete, low-level construal in which the practical details and potential shortcomings of the policy become more salient, fostering more critical evaluations (Jaffé et al., 2019). In this light, alignment profiles are also informative: Champions and Opponents may reflect morally grounded orientations that translate consistently across abstract principles and concrete practices—whether in the form of respectively principled support or principled rejection of D&I policy. Ambivalents may reflect the absence of a clear construal: without sufficient awareness or personal relevance, their responses may remain indeterminate.

Reframing support and resistance in this way calls for a reconsideration of how resistance is understood. Traditionally, resistance is framed as a fixed, cognitive stance of ideological opposition—a barrier to be overcome (Ford et al., 2008). Yet this framing overlooks how resistance may also stem from other sources—such as limited understanding of the policy, uncertainty about how to engage with the policy, or endorsement of distal goals alongside reluctance toward proximal practices—rather than outright attitudinal rejection. The Integrated Model of Organizational Change (IMOC; Kamarova et al., 2025), which integrates Self-Determination Theory (Deci & Ryan, 1985) and organizational change theories, provides a complementary lens for interpreting these motivational underpinnings. Applied to D&I policy, IMOC posits that individuals are more likely to internalize change when three psychological needs are met: mastery (perceiving the policy as clear and feeling able to enact it), meaning (perceiving the policy as legitimate and worthwhile), and belongingness (experiencing social support and a shared normative commitment to D&I policy). When these needs are fulfilled, employees are more likely to show engaged forms of commitment such as cooperation (accepting and adhering to policy) or championing (actively promoting and improving it). When these needs are frustrated, employees may instead show compliance (reluctant, minimum support), passive resistance (withholding effort and disengagement), or active resistance (overt critique and opposition) (cf. Herscovitch & Meyer, 2002; Kamarova et al., 2025; Meyer et al., 2002).

Viewed through this lens, support and resistance are not unidimensional endorsements or rejections of policy; rather, they may reflect distinct constellations of meaning, mastery, and belongingness. Bystanders may remain passive not because they reject D&I, but because vague expectations or role ambiguity leave them uncertain how to act, undermining their sense of mastery. Reluctants may comply behaviorally while remaining attitudinally skeptical about the policy, as doubts about its legitimacy or usefulness weaken meaning. Ambivalents may vacillate because the policy’s content and expectations are unclear, with limited awareness yielding hesitation rather than principled opposition. Champions may exemplify conditions under which all needs are fulfilled, enabling attitudinal endorsement to be internalized and consistently translated into behavioral enactment. Opponents reflect the opposite constellation, reinforcing principled rejection of the D&I policy and non-enactment.

This reframing echoes Wasserman et al.’s (2008) call to view resistance not as a problem to eliminate, but as an opportunity for engagement. Their metaphor of “dancing with resistance” encourages organizations to view hesitation or discomfort not as rejection, but as a dialogic opportunity—an expression of deeper tensions, competing values, or unresolved concerns. In this view, support, resistance, disengagement, ambivalence, and reluctant compliance become indicators of motivational misalignment, rather than fixed ideological positions. Understanding these drivers is critical for more effective policy adoption. Rather than asking how to “overcome resistance,” organizations might instead ask what support conditions enable meaningful engagement.

The Current Research

The study was conducted in a Dutch organization in 2022. That year, D&I gained visible policy momentum in the Netherlands, with the introduction of the gender quota for boardrooms and the national plan to combat discrimination and racism, which increased organizational responsibilities and raised the salience of D&I (National Coordinator against Discrimination and Racism, 2022; Inclusion Quota and Target Figures Act, 2021, art. IIb). In Dutch practice, D&I initiatives often emphasize structural measures, such as objective recruitment and selection procedures (Visser et al., 2025). Historically, policy attention centered primarily on gender equality and, to some extent, migration background, while explicit discussion of race was more limited. In recent years, however, a broader D&I discourse has emerged that increasingly stresses inclusion and adopts an intersectional perspective (Visser et al., 2025). At the same time, heightened visibility has also invited critical scrutiny and fears of backlash, paralleling trends observed in the United States. This dual context of policy momentum and contested legitimacy makes the Dutch setting a timely context to examine how employees and managers engage with organizational D&I policies.

In this study, we adopt a three-pronged, mixed-methods approach to investigate the reasons behind the (lack of) support for organizational D&I policies. Our aim is to move beyond binary conceptualizations of support versus resistance, and instead explore the underlying motivations and meanings behind different configurations of attitudinal and behavioral engagement. The five-cluster taxonomy of D&I policy support was previously validated across a dataset of 27 Dutch organizations (Bokern et al., 2025). The current dataset comes from one of these. This public-sector organization operates in a high-pressure, competitive environment where D&I initiatives may be perceived as secondary to core performance demands (Çelik & Çelik, 2017). The survey distributed in this organization uniquely included an open-ended question about reasons for (non-)support. This design allows us to both demonstrate the robustness of the taxonomy within a single organizational context and deepen it by integrating quantitative clustering with qualitative analyses, thereby uncovering the motivational underpinnings of D&I policy support.

First, we analyze participants’ open-ended reflections on why they (do not) support their organization’s D&I policy. Using qualitative coding, we identify key reasoning patterns. Second, we classify employees into five empirically derived support profiles based on their self-reported attitudinal and behavioral support (Bokern et al., 2025; Jansen et al., 2024). Third, we compare reasoning patterns across support profiles and managerial status, and minority and majority-group members to explore the rationales underlying support, resistance, disengagement, ambivalence, and reluctant compliance. In the Discussion, we interpret the findings through several complementary theoretical lenses—including IMOC, CLT, and SIT—using these frameworks as interpretative tools rather than directly tested mechanisms. By integrating insights from organizational change and behavioral science, this study contributes to a more psychologically informed understanding of how D&I policy is endorsed and enacted in practice.

Method

Participants

Data were collected within a large Dutch organization participating in the Netherlands Inclusivity Monitor (NIM), a large-scale survey approved by the Faculty Ethics Assessment Committee of Utrecht University. Of the 10,428 employees invited, 4,350 started the survey and 2,639 completed it (response rate = 25%). Participants received an email invitation with a survey link. After providing informed consent, they completed questions about demographics, D&I policy support, and an open-ended question.[1] Upon completion, they were debriefed. Table 1 presents the demographic characteristics of the sample, including a breakdown by managerial position.

Table 1

Demographic Background Characteristics

Variable

Full sample(N = 2,639)

Managers(N = 352)

Non-managers(N = 2,286)

Variable

n

%

M

SD

n

%

M

SD

n

%

M

SD

Gender


Male

806

30.54


160

45.45


646

28.26


Female

1,827

69.23


191

54.26


1,636

71.57


Identified as neither man nor woman

5

0.19


1

0.28


4

0.17


Missing

1

0.04


Age (years)


44.10

11.78


48.42

9.53


43.43

11.96

Job tenure (years)


12.06

10.29


14.15

10.17


11.74

10.28

Working hours per week (hours)


32.25

6.24


36.05

5.05


31.68

6.20

Highest educational level


Primary school

2

0.08


2

0.09


Secondary school

44

1.67


1

0.28


43

1.88


Lower vocational education

377

14.29


12

3.41


365

15.97


Higher vocational education

1,106

41.91


104

29.55


1,002

43.83


University

1,109

42.02


235

66.76


873

38.19


Missing

1

0.04


1

0.04


Measures

D&I Policy Support

Attitudinal and behavioral support for the D&I policy were assessed using scales based on the framework by Avery (2011), as applied in Jansen et al. (2024). Responses were given on a 7-point Likert scale (1 = completely disagree, 7 = completely agree).

Attitudinal D&I Policy Support

Attitudinal D&I policy support was assessed with five items (e.g., “I think the diversity policy of this organization is useful”; α = .90).

Behavioral D&I Policy Support

Behavioral D&I policy support was assessed with four items (e.g., “I contribute to the successful implementation of the diversity policy of my organization”; α = .88). We assessed the two-factor structure of the D&I Policy Support scale by conducting a series of confirmatory factor analyses (CFAs) to compare it with alternative models. CFAs were estimated using robust maximum likelihood with Satorra–Bentler–scaled test statistics and robust standard errors, given a violation of multivariate normality indicated by Mardia’s test (Gana & Broc, 2019; Satorra & Bentler, 1994). We initially tested a two-factor model with nine items. Model diagnostics indicated that one item (“I support the diversity policy of this organization”) primarily loaded on an unrelated factor. We evaluated two alternatives that retained this item: a two-factor specification allowing the item to cross-load on both factors, and a three-factor specification. Neither alternative improved model fit relative to the two-factor solution without the item. We therefore excluded the item from further analyses. The final two-factor model with eight items demonstrated good fit (see Table 3 for indices and standardized loadings). Descriptive statistics and correlations are reported in Table 2. To assess the risk of common method bias, we conducted Harman’s single-factor test (Podsakoff et al., 2003). The single-factor solution fitted the data poorly, supporting discriminant validity.

Table 2

Descriptive Statistics and Correlations among Study Variables


n

M

SD

1

2

1. Attitudinal D&I Policy Support

2,639

4.29

0.91


2. Behavioral D&I Policy Support

2,639

4.08

1.09

0.51**

3. D&I Policy Awareness

2,638

3.47

1.52

0.55**

0.47**

Note. **p < .001.

Table 3

Results from a Factor Analysis of the Attitudinal D&I Policy Support and the Behavioral D&I Policy Support Questionnaires

D&I policy support item

Factor loading


1

2

Factor 1: Attitudinal D&I policy support


I think the diversity policy of this organization is credible

0.90


I trust the diversity policy of this organization

0.88


I think the diversity policy of this organization is good

0.83


I think the diversity policy of this organization is useful

0.77


Factor 2: Behavioral D&I policy support


I show others that I consider the diversity initiatives of my organization useful


0.84

I play an active role in letting the diversity policy of my organization succeed


0.82

I publicly declare that I support the diversity policy of my organization


0.80

I contribute to the successful implementation of the diversity policy of my organization


0.75

Note. N = 2,639. Confirmatory factor analysis estimated in lavaan package (Rosseel, 2012) for R, with robust maximum likelihood (MLM; Satorra–Bentler–scaled χ²) and robust standard errors. Reported are standardized loadings (λ). Model fit: SBχ²(19) = 237.66, p < .001; CFI = .967; TLI = .951; RMSEA = .066; SRMR = .047.

Control Variable

As a control variable, D&I policy awareness was assessed with a single item (“I have a clear picture of the D&I policy of my organization”), rated on a 7-point Likert scale (1 = completely disagree, 7 = completely agree).

Open-Ended Question

Participants elaborated on their (non-)support by answering: “Could you explain why you do or do not support your organization’s D&I policy?” Of respondents, 1,407 (53%) provided a response.

Perceived Minority Status

Perceived minority status was assessed using two items adapted from Hobman et al. (2004), consistent with prior work (Şahin et al., 2019). Participants indicated whether they perceived themselves as (1) visibly different from others at work (e.g., age, gender, ethnicity) and/or (2) invisibly different (e.g., values, political preference, personality). Response options were “yes” or “no.” Respondents who endorsed at least one form of perceived dissimilarity were classified as having perceived minority status, reflecting a subjective sense of being different from most others at work, whereas those responding “no” to both items were categorized as having perceived majority status (i.e., perceiving similarity to others).

Self-Identified Minority-Group Membership

Self-identified minority-group membership was measured by asking respondents whether they belonged to any of the following target groups: identifying as LGBTQIA+, being an informal caregiver, having a visible and/or invisible disability, being actively religious, or having a migration background. Response options were “yes” or “no”. Participants who reported membership in at least one target group were coded as belonging to the self-identified minority group, and all others as belonging to the self-identified majority group.

Data Analysis Strategy

Our analytical strategy aimed to deepen understanding of why employees express attitudinal and behavioral support—or lack thereof—for their organization’s D&I policy. We adopted a mixed-method approach combining qualitative content coding, latent class analysis (LCA), and k-means cluster analysis.

Step 1: Qualitative Content Analysis

We analyzed open-ended responses in ATLAS.ti 23.2.1 using three coding phases (open, axial, and selective), resulting in nine themes and 19 subthemes (Boeije, 2010). An independent second coder subsequently coded 50% of responses (N = 704) using the finalized codebook. Interrater reliability was excellent (κ = .89; McHugh, 2012), and inconsistencies were discussed and resolved collaboratively. The detailed coding procedure and the full codebook are provided in Supplement A. We also examined variation in the likelihood of providing an open-ended response across support clusters, as this serves as a proxy for the willingness to reflect on and articulate one’s stance.

Step 2: Latent Class Analysis

To uncover patterns in the open-ended responses, we conducted latent class analysis (LCA) using the presence or absence of the 19 subthemes as input. LCA is a statistical technique for identifying latent profiles of reasoning—underlying constellations in how participants articulated their (non-)support (Hagenaars & McCutcheon, 2002). Models specifying one to six classes were estimated using the poLCA package in R (R Core Team, 2023). The optimal model was selected based on model fit indices, group size, and its theoretical interpretability (see Table 4 for model fit indices).

Table 4

Model fit indices of the estimated latent class models 


Model fit criteria

Diagnostic criteria

Models

Log Likelihood

saBIC

AIC

L2

df

p

Smallest class count (n)

Smallest class size (%)

3 Class

-5859.28

11722.64

11836.57

1170.38

1348

1.00

389

27.6

4 Class

-5796.96

11598.00

11751.93

1045.74

1328

1.00

117

8.3

5 Class

-5757.51

11519.09

11713.02

966.83

1308

1.00

128

9.1

6 Class

-5724.22

11514.34

11686.44

900.26

1288

1.00

46

3.3

Note. N = 1,407; saBIC = sample-size adjusted Bayesian information criterion; AIC = Akaike information criterion; L2=Log-Likelihood squared; df = degrees of freedom; The model of selection is bolded.

Step 3: K-means Clustering

We applied k-means clustering to attitudinal and behavioral support scores, identifying five support profiles: Champions, Reluctants, Ambivalents, Bystanders, and Opponents, consistent with prior work (Bokern et al., 2025). To assess the robustness of the clustering, we conducted a sensitivity analysis including D&I policy awareness as an additional dimension (McCrory & Thomas, 2025). Our choice to use k-means for attitudinal and behavioral profiles reflects continuity with the original taxonomy (Bokern et al., 2025; Jansen et al., 2024) and preserves direct comparability with prior work. In addition to this theory‐informed decision, we conducted empirical checks which provided no reason to deviate from our choice to set k equal to five. This analysis is included in Supplement B.

Step 4: Integration of Reasoning Patterns and D&I Policy Support Clusters

Finally, we examined how the reasoning patterns from Step 2 were distributed across the support clusters from Step 3. This integration provided insight into the motivational underpinnings of different types of (non-)support. Associations were tested using Pearson’s chi-square and adjusted residuals. We also explored whether these patterns differed between managers and employees, and between minority and majority-group members. Analyses were conducted in R (version 4.2.3).

Because the dataset contains sensitive information collected as part of an ongoing monitor, the full data cannot be made publicly available. Data are available from the authors upon reasonable request for verification purposes.

Results

Reasoning Behind D&I Policy Support

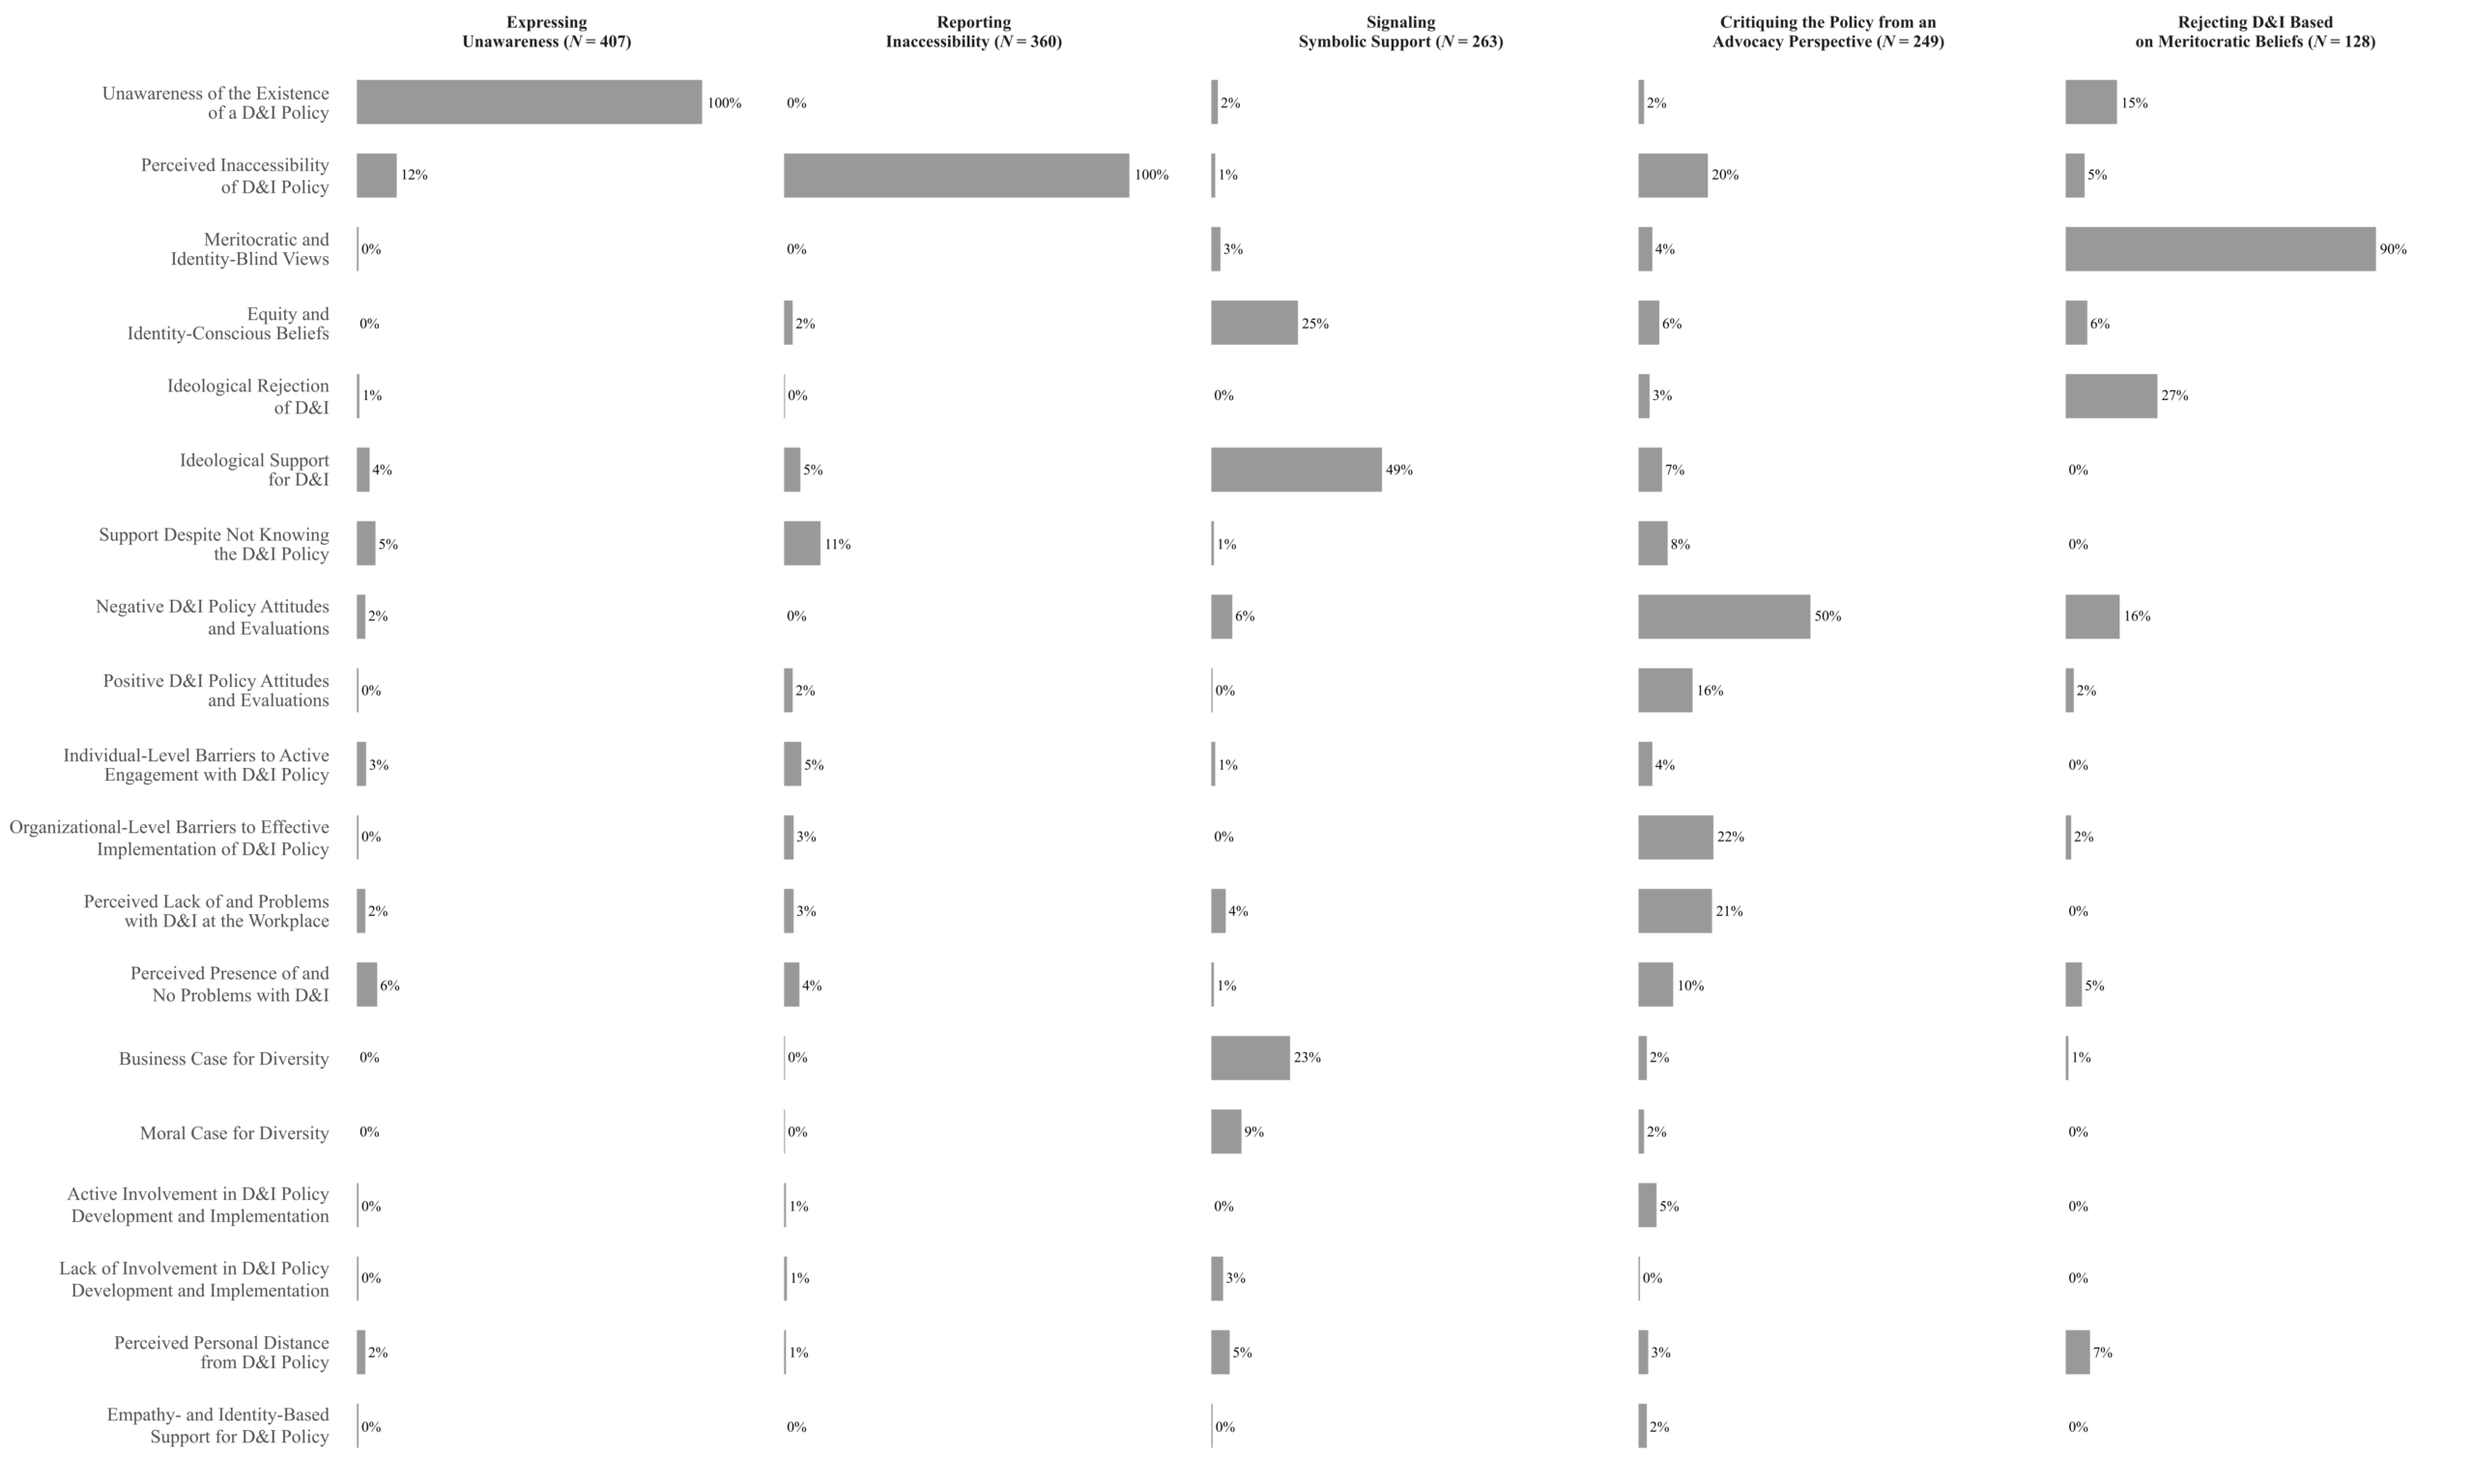
As mentioned earlier, our first goal was to explore why individuals support or oppose their organization’s D&I policy. LCA revealed five distinct reasoning patterns, each reflecting characteristic ways in which respondents articulated (non-)support. Figure 2 displays the estimated conditional probabilities for all subthemes across classes. Full conditional probabilities for all subthemes across the five latent classes, along with the overall observed prevalences, are reported in Supplement Table S2.

Figure 2

Conditional Probabilities for Five D&I Support Reasoning Patterns Derived From Latent Class Analysis

Expressing Unawareness (29%)

Unawareness of the organization’s D&I policy was reported by 29% of respondents. As described by Respondent 353: “I have no idea what, or whether, there even is a diversity policy within the organization.” These responses indicate the policy was either not encountered or entirely unknown and did not reference its content or broader ideological views on D&I.

Reporting Inaccessibility (26%)

Difficulties accessing the D&I policy were reported by 26%. As illustrated by Respondent 191: “It’s not clear to me where to find it or how it is communicated.” These responses emphasized practical inaccessibility and often referred to problems locating or interpreting the policy, typically attributed to unclear communication or insufficient policy clarity. References to broader ideological positions on D&I were largely absent.

Signaling Symbolic Support (19%)

A symbolic or principle-based endorsement was reported by 19%. As Respondent 96 noted: “I think it’s important that everyone feels heard and seen, regardless of who they are or what they believe.” This reasoning often included references to equity and social justice values (25%) and the business case for diversity (23%). Nearly half of the responses (49%) contained expressions of normative support for diversity as a general principle. However, the support remains detached from the organization’s actual policy, as no references are made to the actual content or implementation of the organization’s D&I policy.

Critiquing Policy from an Advocacy Perspective (18%)

Critical engagement with the D&I policy was expressed by 18% of respondents. This reasoning often voiced concerns about the adequacy and effectiveness of the policy’s content and implementation (50%), as described by Respondent 219: “I do support diversity policies and I see that there has been progress, but the policy so far has fallen so short that I cannot stand behind it.” They frequently pointed to organizational barriers that hinder its effective implementation (22%), a negative D&I climate at work (21%), and difficulties accessing the policy (20%). While dissatisfaction was a recurring theme, this reasoning pattern also showed the highest level of positive policy evaluations across all patterns (16%). Rather than rejecting D&I as an organizational value or strategic priority, these responses reflected constructive critique.

Rejecting D&I Based on Meritocratic Beliefs (9%)

A principled rejection of D&I was expressed by 9% of respondents. This rejection was often grounded in meritocratic, universalistic, or identity-blind beliefs (90%). As Respondent 2671 noted: “Personally, I believe you should put the right person in the right position regardless of gender, background, religion, etc.” This reasoning pattern also showed the highest levels of ideological rejection of D&I (27%) across all reasoning patterns.

Clusters of D&I Policy Support

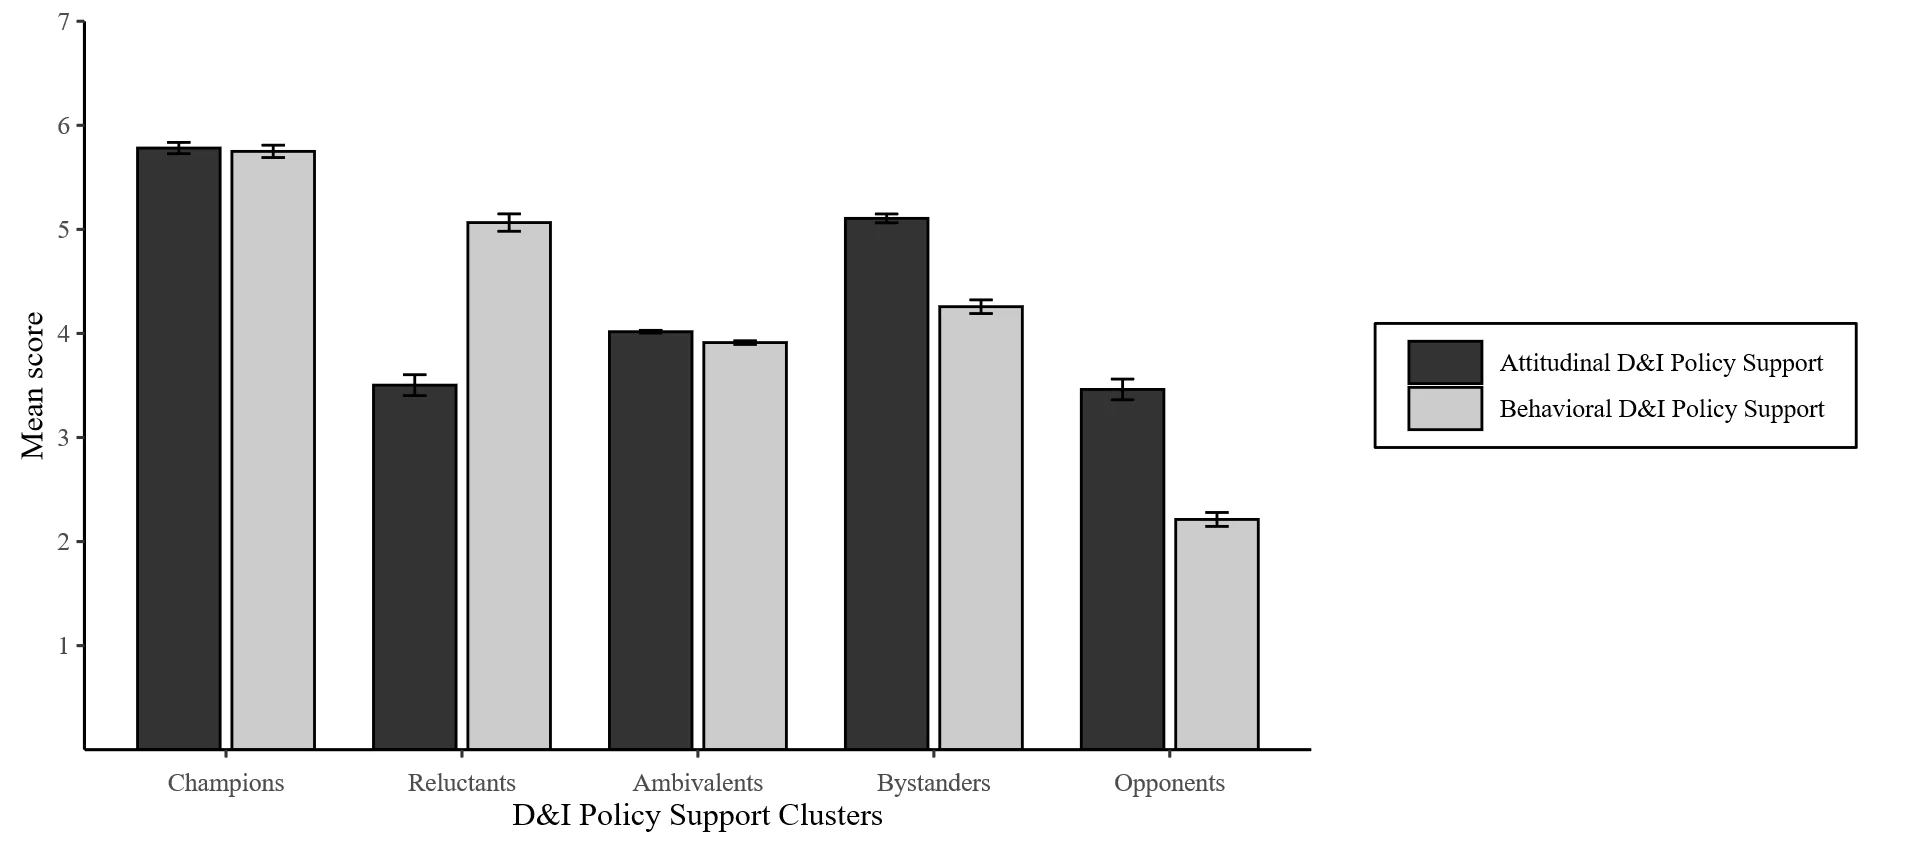
Using k-means clustering on attitudinal and behavioral D&I policy support scores, we clustered participants into five distinct D&I policy support groups: Champions (N = 338, 13%), who scored high on both attitudinal and behavioral support; Bystanders (N = 410, 16%), who scored high on attitudinal support yet low on behavioral support; Ambivalents (N = 1,303, 49%), who scored around the midpoint on both dimensions; Reluctants (N = 241, 9%), who scored low attitudinal support yet high on behavioral support; and Opponents (N = 347, 13%), who scored low on both attitudinal and behavioral support. See Figure 3 for mean attitudinal and behavioral scores by cluster.

We treated policy awareness as a planned robustness check. We reran k-means clustering with policy awareness as a third indicator. The five-profile taxonomy and its substantive interpretation were preserved. Including awareness did not redefine the clusters, indicating that the profiles are not methodological artefacts of policy awareness (see Supplement D).

Figure 3

Mean Attitudinal and Behavioral D&I Policy Support by D&I Policy Support Clusters

Linking Reasoning Patterns to Support Clusters

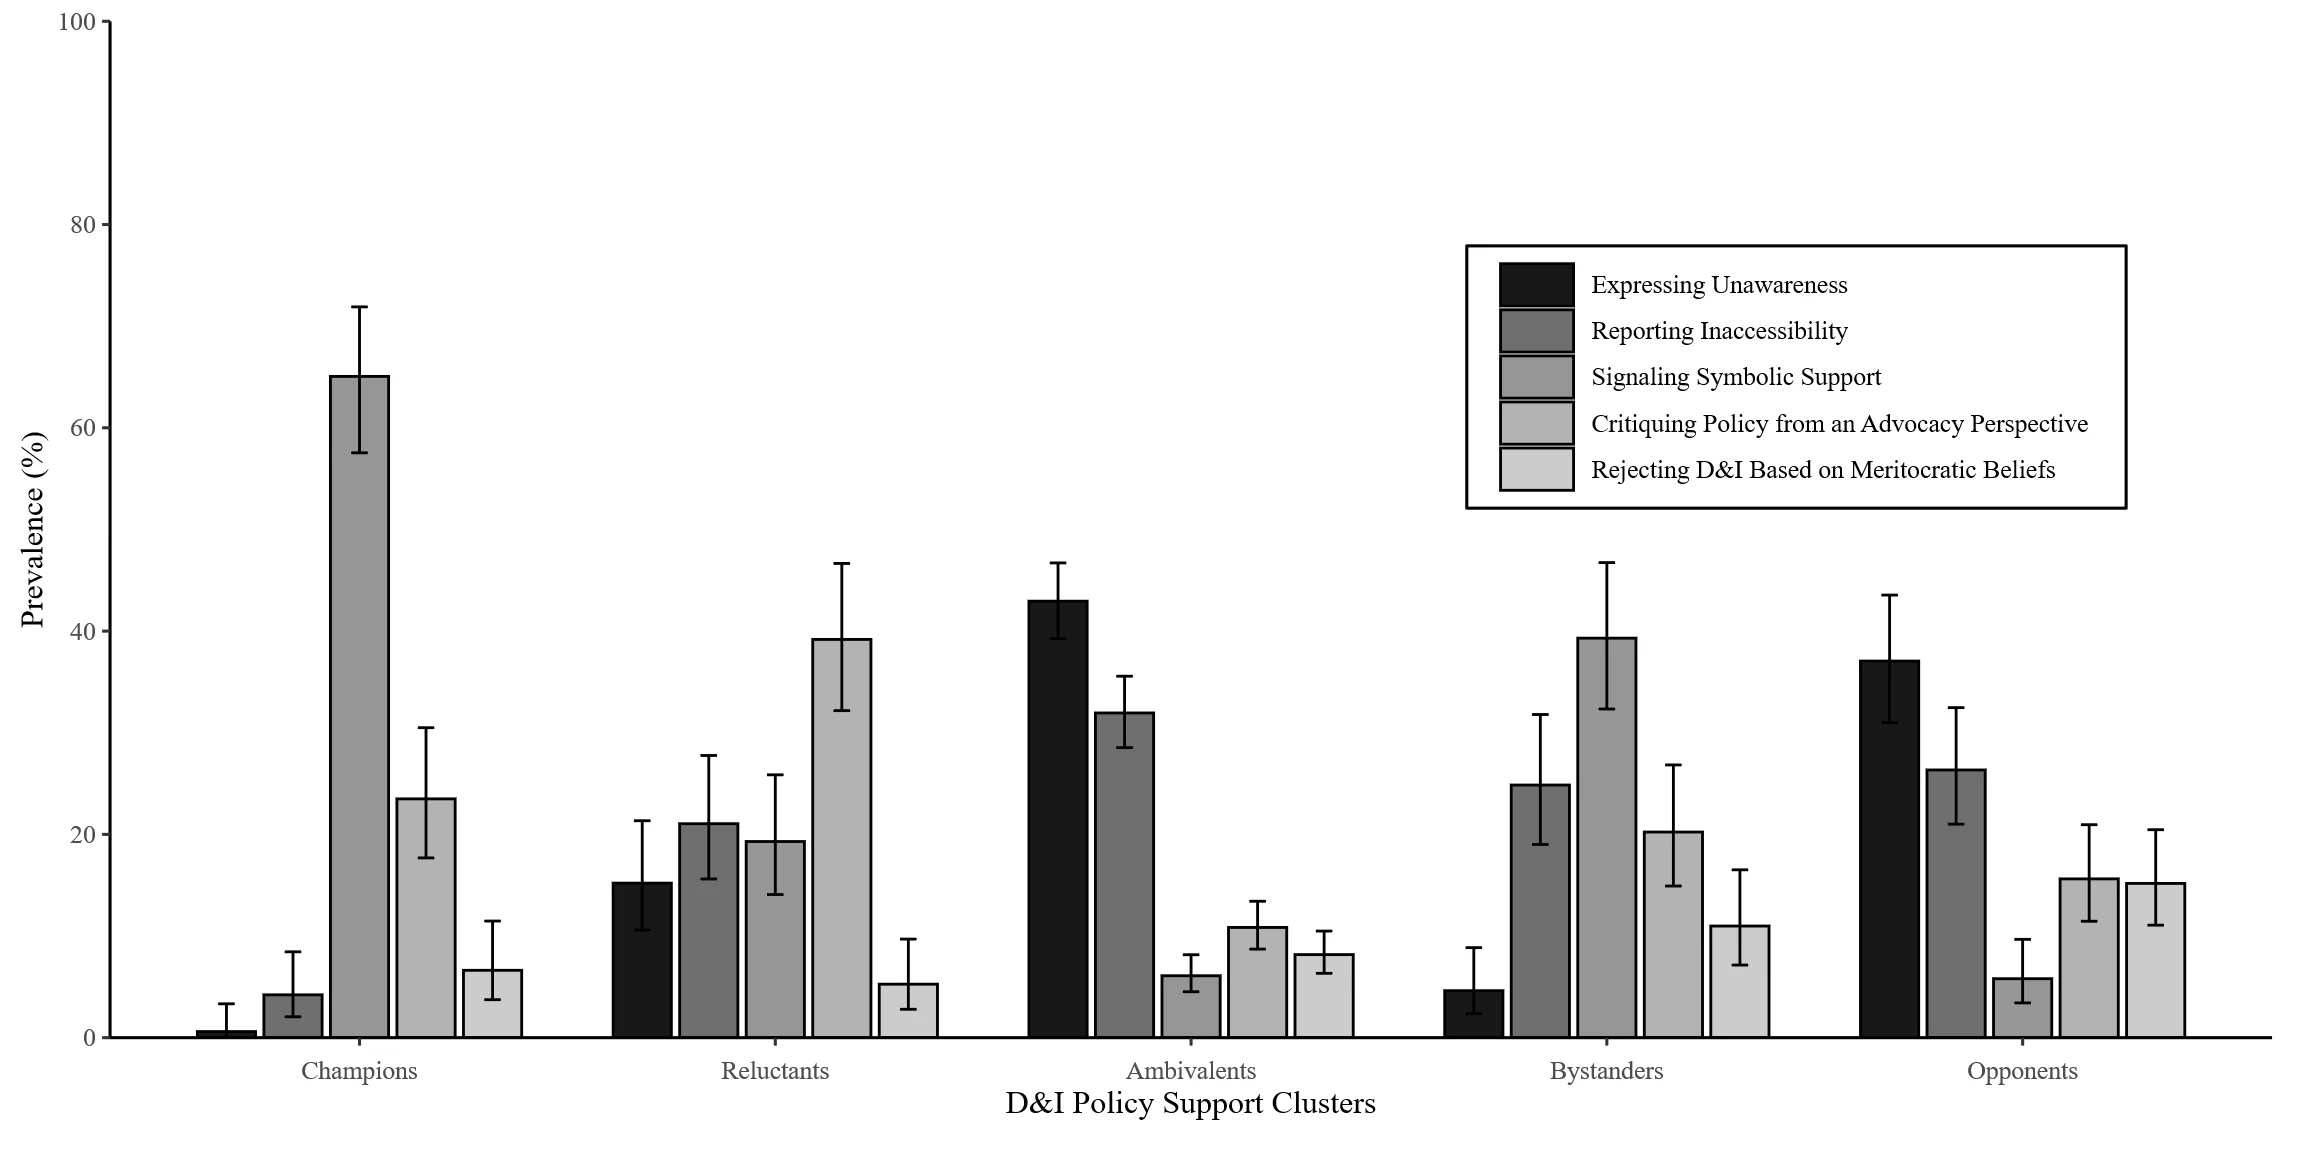
We examined how the five reasoning patterns were distributed across the previously identified D&I policy support clusters. A chi-square test of independence revealed a significant association between the two classifications, χ²(16, N = 1,407) = 573.46, p < .001, Cramér’s V= .32. Adjusted residuals (Agresti, 2007) indicated that Opponents were significantly more likely to Express Unawareness and to Reject D&I Based on Meritocratic Beliefs, and less likely to Signal Symbolic Support.Bystanders were significantly more likely to Signal Symbolic Support and less likely to Express Unawareness.Ambivalents were significantly more likely to Express Unawareness or to Report Inaccessibility, and less likely to Signal Symbolic Support or to Critique the Policy from an Advocacy Perspective.Reluctants were significantly more likely to Critique the Policy from an Advocacy Perspective and less likely to Express Unawareness. Champions were significantly more likely to Signal Symbolic Support and, to a lesser extent, to Critique the Policy from an Advocacy Perspective, and less likely to Express Unawareness or to Report Inaccessibility (see Table 5 and Figure 4 for distributions).

Table 5

Cross-Tabulation of D&I Policy Support Clusters (k-means) by Reasoning Patterns (LCA)


Reasoning Patterns

Total


Expressing Unawareness

Reporting Inaccessibility

Signaling Symbolic Support

Critiquing Policy from an Advocacy Perspective

Rejecting D&I Based on Meritocratic Beliefs

Total

Opponents

n

83

59

13

35

34

224


%

37.1

26.3

5.8

15.6

15.2


Adjusted residual

2.93

0.28

-5.40

-0.89

3.45


p-value

<.001

.778

<.001

.375

<.001


Bystanders

n

8

43

68

35

19

173


%

4.6

24.9

39.3

20.2

11.0


Adjusted residual

-7.53

-0.24

7.43

0.93

0.92


p-value

<.001

.814

<.001

.351

.357


Ambivalents

n

289

215

41

73

55

673


%

42.9

31.9

6.1

10.8

8.2


Adjusted residual

11.10

5.24

-11.61

-6.45

-1.16


p-value

<.001

<.001

<.001

<.001

.248


Reluctants

n

26

36

33

67

9

171


%

15.2

21.1

19.3

39.2

5.3


Adjusted residual

-4.22

-1.45

0.22

7.85

-1.86


p-value

<.001

.147

.828

<.001

.063


Champions

n

1

7

108

39

11

166


%

0.6

4.2

65.1

23.5

6.6


Adjusted residual

-8.57

-6.72

16.32

2.08

-1.18


p-value

<.001

<.001

<.001

.037

.239

 
Note. Observed frequencies are distinguished by the five k-means clusters and the five D&I support motivation profiles identified through latent class analysis (LCA). Adjusted residuals indicate whether the observed frequency in a particular cell deviates significantly from the expected frequency under the assumption of independence. Overall chi-square: χ²(16, N = 1,407) = 573.46, p < .001, Cramér’s V= .32

Figure 4

Distribution of Reasoning Patterns Across D&I Policy Support Clusters

Of the 2,639 participants, 1,407 (53%) provided an open-ended explanation of why they did or did not support their organization’s D&I policy. A chi-square test of independence showed that open-ended response rates differed across clusters, χ²(4, N = 2,639) = 71.95, p < .001, Cramér’s V = .16. Adjusted standardized residuals indicated that Reluctants and Opponents were more likely to provide a reason, whereas Bystanders were less likely. Within-cluster response rates were: Reluctants = 71%, Opponents = 65%, Ambivalents = 52%, Champions = 49%, and Bystanders = 42%. The subsample of employees who provided an open-ended explanation was broadly comparable to the full survey sample. Response rates did not differ significantly by managerial status, gender, or self-identified minority-group membership. However, employees with perceived minority status were more likely to provide an open-ended explanation (58%) than those with perceived majority status (51%), χ²(1, N = 2,627) = 10.34, p = .001.

Managerial Differences in D&I Policy Support and Underlying Reasoning Patterns

To examine whether D&I policy support and reasoning patterns differed between employees with and without managerial responsibilities, we tested associations between managerial status and both latent support clusters and reasoning patterns using chi-square tests of independence. Managerial status was associated with D&I support cluster membership, χ²(4, N = 1,407) = 573.46, p < .001, Cramér’s V = .32. Standardized residuals revealed that managers were significantly overrepresented among Champions and Reluctants, and underrepresented among Ambivalents and Opponents, aligning with previous research (Bokern et al., 2025; see Table 6 for distributions). Furthermore, managerial status was associated with reasoning pattern, χ²(4, N = 1,407) = 31.92, p < .001, Cramér’s V = .15. Managers were significantly more likely than employees to Signal Symbolic Support and Critique Policy from an Advocacy Perspective, while less likely to Express Unawareness of the organization’s D&I policy.

A closer qualitative look at the answers within each cluster reveals slightly distinct patterns between managers and non-managers. For example, within Champions, managers more often emphasized the business case and moral case for diversity, whereas non-managers more often articulated general ideological support. Within Opponents, managers more frequently cited negative perceptions of the organizational D&I climate and a sense of personal distance from the D&I policy, while non-managers relatively more often referred to policy unawareness and meritocratic beliefs. Among Reluctants, managers more often mentioned organizational barriers that hinder the implementation and effectiveness of the organization’s D&I policy and moral case for diversity. Within Bystanders and Ambivalents, differences were smaller and less consistent.

Table 6

Cross-Tabulation of D&I Policy Support Clusters by Managerial Status


D&I Policy Support Cluster

Total


Opponents

Bystanders

Ambivalents

Reluctants

Champions

Total

Managerial position

n

23

58

122

57

92

352


Percentage

6.5

16.5

34.7

16.2

26.1


Adjusted residuals

-3.95

.52

-5.92

4.94

8.03


p-value

<.001

.603

<.001

<.001

<.001


Non-managerial position

n

324

352

1,180

184

246

2,286


Percentage

14.2

15.4

51.6

8.0

10.8


Adjusted residuals

3.95

-.52

5.92

-4.94

-8.03


p-value

<.001

.603

<.001

<.001

<.001

 
Note. Values are (1) observed frequencies of employees with and without managerial responsibilities; (2) row percentages, that is, the percentage of managers and non-managers within each D&I policy support cluster; and (3) adjusted residuals, which indicate whether the observed frequency in a cell differs significantly from the expected frequency under the assumption of independence. p-values are based on the adjusted residuals. Overall chi-square: χ²(4, N = 2,638) = 109.96, p < .001, Cramér’s V =.20

Group Status Differences in D&I Policy Support and Underlying Reasoning Patterns

We examined whether cluster membership was associated with perceived minority status and self-identified minority-group membership. For perceived minority status, a chi-square test indicated a significant association with cluster membership, χ²(4, N = 2,627) = 59.28, p < .001, Cramér’s V=.15. Minority-group members (based on subjective perception of being different) were overrepresented in the more critical profiles, particularly Reluctants and Opponents, whereas majority-group members were overrepresented in Ambivalents (see Table 7 for distributions). Perceived minority status was also significantly associated with latent reasoning profiles, χ²(4, N = 1,405) = 34.55, p < .001, Cramér’s V = .16. Minority-group respondents were substantially more likely to Critique Policy from an Advocacy Perspective, whereas majority-group respondents were more likely to Express Unawareness of the D&I policy.

Table 7

Cross-Tabulation of D&I Policy Support Clusters by Perceived Minority Status


D&I Policy Support Cluster

Total


Opponents

Bystanders

Ambivalents

Reluctants

Champions

Total

Perceived minority status

n

134

112

340

115

95

796


Percentage

16.8

14.1

42.7

14.4

11.9


Adjusted residuals

3.66

-1.36

-4.45

6.23

-0.94


p-value

<.001

.173

<.001

<.001

.347


Perceived majority status

n

212

296

955

125

243

1,831


Percentage

11.6

16.2

52.2

6.8

13.3


Adjusted residuals

-3.66

1.36

4.45

-6.23

0.94


p-value

<.001

.174

<.001

<.001

.347

 
Note. Observed frequencies are distinguished by the five k-means clusters and perceived minority status. Perceived minority status was defined as respondents who indicated feeling different from others in the organization. Adjusted residuals indicate whether the observed frequency in a particular cell deviates significantly from the expected frequency under the assumption of independence. Overall chi-square: χ²(4, N = 2,627) = 59.28, p < .001, Cramér’s V =.15

A closer look at the subtheme patterns within each support cluster reveals distinct nuances between subjective minority and majority-group members. Among Opponents, minority-group members were much more likely to express critical views on the content, scope, and effectiveness of the D&I policy, whereas majority-group members more often reported unawareness of the existence of a D&I policy. Within Reluctants, minority-group members more often highlighted a perceived lack of and problems with D&I at the workplace, whereas majority-group members more frequently expressed ideological support for D&I as a general organizational goal and indicated unawareness of the specific D&I policy. Within Bystanders, Champions, and Ambivalents, differences between minority and majority-group members were generally smaller and less consistent.

For self-identified minority-group membership, a chi-square test also indicated a significant, though weaker, association, χ²(4, N = 2,638) = 11.74, p = .002, Cramér’s V=.07. Employees belonging to one or more marginalized groups were slightly overrepresented among Reluctants (see Table 8 for distributions). For reasoning patterns, the association was not statistically significant, χ²(4, N = 1,407) = 7.32, p = .120, Cramér’s V = .07, although self-identified minority employees showed a modest trend toward greater likelihood of Critiquing Policy from an Advocacy Perspective. A closer qualitative look within Reluctants reveals subtle distinctions. Self-identified minority-group members tended to base their reservations on a perceived lack of and problems with D&I at the workplace and negative evaluation and critical stance to the current D&I policy of their organization, whereas employees not belonging to a self-identified minority group more often reported unawareness of the policy.

Table 8

Cross-Tabulation of D&I Policy Support Clusters by Self-Identified Minority-Group Membership


D&I Policy Support Cluster

Total


Opponents

Bystanders

Ambivalents

Reluctants

Champions

Total

Minority group

n

143

176

536

127

150

1,132


Percentage

12.6

15.5

47.3

11.2

13.3


Adjusted residuals

-0.69

0.01

-1.79

3.22

0.58


p-value

.492

.994

.074

<.001

.559


Majority group

n

204

234

766

114

188

1,506


Percentage

13.5

15.5

50.9

7.6

12.5


Adjusted residuals

0.69

-0.01

1.79

-3.22

-0.58


p-value

.492

.994

.074

<.001

.559

 
Note. Observed frequencies are distinguished by the five k-means clusters and self-identified minority-group membership. Self-identified minority-group membership was defined as respondents who indicated belonging to at least one of the following groups: identifying as LGBTQIA+; being an informal caregiver; having a visible and/or invisible disability; being actively religious; or having a migration background. Adjusted residuals indicate whether the observed frequency in a particular cell deviates significantly from the expected frequency under the assumption of independence. Overall chi-square: χ²(4, N = 2,638) = 11.74, p = .002, Cramér’s V =.07

Discussion

This study set out to examine how and why employees and managers support—or do not support—their organization’s D&I policies, considering both the attitudinal endorsement and behavioral enactment. Using a mixed-methods approach, we identified five support profiles—Champions, Reluctants, Ambivalents, Bystanders, and Opponents—and explored the reasoning patterns behind each.

A Multidimensional View of D&I Policy Support

Our findings corroborate earlier work (Bokern et al., 2025; Jansen et al., 2024) by showing that D&I policy support is multidimensional rather than reducible to attitudes alone. While some respondents aligned attitude and behavior—such as Opponents and Champions—others expressed attitudinal support without engagement (Bystanders), showed behavioral enactment while being attitudinally skeptical (Reluctants), or showed uncertainty in both dimensions (Ambivalents). These findings echo dual-process models of intention and behavior (Sheeran & Webb, 2016), which highlight that attitudes and behaviors frequently diverge.

Reframing Support and Resistance: Beyond Ideology

Where previous research often attributes resistance primarily to ideological rejection or bias (Leslie, 2019; Plaut et al., 2011), our analysis indicates a broader range of motives, including unawareness, uncertainty, and constructive critique. Integrating clusters and reasoning patterns helps explain why individuals do or do not endorse and enact D&I policy. To interpret these diverse patterns, we used the Integrated Model of Organizational Change (IMOC) as an interpretative lens, which helps conceptualize support as shaped by three psychological needs: mastery (feeling capable of contributing to D&I policy implementation), meaning (perceiving it as legitimate and purposeful), and belongingness (experiencing a shared normative commitment to it). The fulfillment or frustration of these needs foster distinct forms of commitment ranging from cooperation and championing to compliance, passive withdrawal, or active resistance (Herscovitch & Meyer, 2002).

Champions show high attitudinal endorsement and behavioral enactment, indicating strong alignment. They often express strong ideological support for D&I as a moral imperative while also offering constructive feedback on policy implementation. In IMOC terms, they regard the policy as important (high meaning), and know what is expected and feel able to contribute, for example by constructively critiquing the policy with the aim of refinement (high mastery), with some describing D&I as—or as it ought to be—the organizational norm (signals of belongingness). Such conditions correspond to behavioral commitment forms such as cooperation (accepting and enacting the policy) or championing (actively promoting and constructively refining it). Within the SHRM chain, Champions potentially strengthen the link between intended policies and both their enactment and perception: their intrinsic valuing of D&I and constructive engagement can help ensure that policies are implemented consistently and perceived as credible.

Bystanders express high attitudinal support but remain behaviorally passive, indicating misalignment. They frequently voice symbolic or affective support, describing D&I as an important moral value, yet show limited engagement with policy content or implementation. Because they do not typically report being unaware of the policy, their disengagement is unlikely to stem from lack of awareness. This pattern reflects a principle–implementation gap: Bystanders endorse diversity at an abstract level but disengage when concrete organizational practices are at stake (Dixon et al., 2010). Their emphasis on moral values without reference to policy content supports this interpretation. Such abstract moral endorsement may also serve impression-management or moral self-image functions, allowing individuals to affirm egalitarian values without engaging in concrete policy enactment (Ellemers, 2017). Through the IMOC lens, Bystanders indicate that they perceive D&I as an important organizational value (signaling meaning). Their lack of behavioral enactment, while not primarily rooted in policy unawareness, may indicate that they are uncertain about how to act (limited mastery) or that they do not perceive sufficient support to engage (limited belongingness). These conditions are consistent with passive withdrawal—a form of resistance marked by disengagement and inaction. In the SHRM process, such passivity potentially creates a breakpoint between intended and implemented policy: endorsement of D&I in principle without enactment may leave implementation partial and inconsistent.

Ambivalents report moderate support in both domains, often citing lack of awareness or access rather than explicit resistance. This uncertainty about what the policy entails—or even whether it exists—may preclude fully formed IMOC appraisals of meaning, mastery, or belongingness, thereby limiting opportunities for engagement. In SHRM terms, Ambivalents may represent a breakpoint between implemented and perceived policy—or even at the implemented stage itself when the policy is absent or inaccessible: limited awareness potentially constrains recognition, dampens responses, and stalls enactment.

Reluctants demonstrate behavioral support for their organization’s D&I policy despite reporting lower attitudinal support for it, indicating misalignment between attitudinal evaluation and behavioral engagement. Rather than rejecting D&I as an organizational value or goal to strive for (the why), they tend to question the policy content, scope, and effectiveness or aspects of its implementation (the how) and advocate for strengthening, expanding, better embedding, or making the policy more inclusive and visible. In line with CLT, their responses reflect a focus on concrete details of implementation—such as feasibility, fairness, or effectiveness—which makes them more critical of the policy even as they engage behaviorally (Jaffé et al., 2019). Interpreted through IMOC, Reluctants experience the capability to actively engage with the policy by promoting it and critiquing it with the aim of refinement (high mastery). At the same time, they express doubts about its effectiveness (low meaning). Their level of belongingness is difficult to infer. These conditions may foster compliance rather than endorsement—commitment characterized by fulfilling expectations while withholding full support. Within the SHRM chain, such critical compliance may ensure that policies are implemented as intended, yet the accompanying scrutiny potentially signals misalignment with employees’ own values and needs, risking weaker perceptions of policy credibility.

Opponents display consistent attitudinal and behavioral resistance. Their responses often reflect principled rejection of D&I grounded in meritocratic or identity-blind beliefs, or policy unawareness. From an IMOC perspective, they do not perceive D&I as legitimate and as an organizational value (low meaning), and they lack motivation to engage (low mastery). They also signal low belongingness, such as opposing D&I as an organizational norm. These conditions foster active resistance—commitment characterized by overt rejection and non-enactment. In SHRM terms, Opponents potentially obstruct multiple links in the chain: their principled rejection and unfamiliarity with the policy may block implementation, undermine positive perceptions, and ultimately jeopardize intended outcomes.

Managerial Role

Managers were significantly overrepresented among Champions and Reluctants, suggesting higher behavioral engagement with D&I policy regardless of attitudinal alignment. As a result, they were also more likely to exhibit the reasoning patterns associated with these groups, namely symbolic support and critical engagement. This engagement did not simply reflect role-based obligation. Many managers supported the purpose of D&I but voiced skepticism about its scope and effectiveness. For example, Reluctants frequently described organizational barriers or unclear processes, suggesting that their critical stance often reflected perceived shortcomings in how D&I was enacted, rather than fundamental opposition to its goals.

Drawing on Regulatory Focus Theory (Higgins et al., 1997), managers may be more likely to adopt a promotion focus, emphasizing strategic advancement and long-term organizational benefits, whereas non-managers more often showed a prevention focus, prioritizing procedural clarity and alignment with personal values. This may explain why managers, especially Reluctants, engaged with D&I despite skepticism: they saw instrumental value in supporting policy implementation, even when skeptical about its practical impact.

Practical Implications

Our findings offer insight into how organizations might more effectively “dance with resistance” (Wasserman et al., 2008). In recent years, D&I has gained policy momentum in the Netherlands and beyond, but its heightened salience has also invited critical scrutiny. This criticism is often portrayed as a uniform “backlash,” yet our study shows it is far from monolithic. Instead, resistance fragments into distinct patterns: unawareness, inaccessibility, symbolic support without enactment, constructive advocacy-oriented critique, and meritocracy-based rejection. Rather than treating resistance as something to be overcome, our results suggest it can serve as a signal—an invitation to listen, engage, and adjust course. Employees’ responses often reflect more than simple rejection or support: they may indicate lack of awareness, limited understanding, uncertainty about how to engage, or criticism of the policy itself. Yet many D&I strategies still rely heavily on attitude change interventions, despite evidence that attitudes are resistant to change (Maio et al., 2018; Petty & Cacioppo, 1986) and that attitude shifts do not necessarily predict behavior (Sheeran & Webb, 2016). Our findings confirm this: individuals may act without endorsement (Reluctants) or express support without engagement (Bystanders). Simply changing minds does not guarantee engagement.

Instead, fostering sustained engagement requires addressing multiple pathways—making policies visible, accessible, relevant, and actionable. Different support profiles highlight where specific barriers are most salient. For Ambivalents, the issue is not opposition but disconnection; interventions should focus on policy accessibility and clarity to prevent employees from remaining unaware or excluded. For Opponents, the issue is more fundamental. Interventions may need to focus on clarifying the rationale for D&I policies and establishing clear behavioral expectations, fostering at least normative or continuance commitment rather than affective (Herscovitch & Meyer, 2002). For Bystanders, symbolic support is present, but confidence or guidance to engage are lacking. Organizations should strengthen mastery by providing clearer expectations, examples, and support to translate values into behavior. For Reluctants, the key is to recognize constructive resistance. Their critique is not a rejection of D&I, but an expression of care for how it is enacted. Rather than suppressing critical voices, organizations may benefit from involving them in participatory design processes. For Champions, the task is not persuasion but empowerment. They can serve as role models or ambassadors—but only if given space and recognition.

Beyond these profile-specific implications, it is also important to consider who these profiles represent. A common assumption in both research and practice is that employees from minority groups—those whom D&I policies are often designed to benefit—are uniformly more supportive of such policies, whereas majority or dominant groups, who are less directly affected, are presumed to drive resistance. Our findings nuance this assumption: both majority and minority-group employees—where minority status was defined either subjectively as perceiving oneself as different from most others at work, or as self-identifying as belonging to groups typically underrepresented and disadvantaged in organizational contexts (e.g., LGBTQIA+ individuals, informal caregivers, employees with visible or invisible disabilities, actively religious employees, or employees with a migration background)—appeared across all support profiles, with minority-group employees more strongly represented in the more critical clusters (Reluctants and, to a lesser extent, Opponents). Consistent with SIT, D&I policy may be more self-relevant for minoritized employees, which can heighten expectations and scrutiny. While prior work typically finds that minority-group members express stronger support for D&I in abstract terms or toward specific D&I initiatives, our findings reveal a more nuanced pattern when it comes to the concrete D&I policy implemented within their own organization. Their overrepresentation in the more critical clusters reflects critical support: endorsement of the organizational aims of D&I combined with dissatisfaction about how effectively these aims are realized in practice, rather than rejection of D&I as such. Furthermore, majority-group employees were overrepresented among Ambivalents, indicating they were less informed about the D&I policy. Rather than reflecting principled rejection, this pattern reflects a more distant relationship to D&I policy content, as suggested by both CLT and SIT. Together, these patterns indicate that support for or resistance to D&I policy cannot be accounted for by demographic background alone. Rather, distinct constellations of attitudinal endorsement and behavioral engagement were observed across groups, underscoring the need for organizational responses to be tailored to support profiles rather than demographic categories.

Limitations and Directions for Future Research

The approach we chose to investigate employee motives for (not) supporting D&I policies has several strengths but also entails some limitations. First, our reliance on self-report survey data—combining validated Likert-type scales and open-ended responses—carries the risk that participants underreport socially undesirable attitudes or overstate positive engagement. We adopted this approach deliberately to maximize ecological validity, as our main interest was in employees’ own motives (Patton, 2014). Although social desirability bias may have contributed to the relatively high frequency of Champions and the low frequency of Opponents, this pattern is consistent with broader surveys showing that many employees express support for diversity initiatives (McKinsey & Company, 2020; Pew Research Center, 2023). Response behaviors in the open-ended question also partly mitigate this concern: those in rejecting or critical groups (Opponents and Reluctants) were relatively more likely to elaborate their views, suggesting they did not systematically refrain from dissent. Conversely, Bystanders—an ideologically supportive group—were relatively less inclined to provide detailed explanations, perhaps reflecting a more unreflective endorsement. The qualitative subsample was broadly comparable to the full survey sample, although employees who subjectively identified as belonging to a minority group were somewhat more likely to provide an open-ended explanation—consistent with the idea that D&I policy is more self-relevant for these employees, and may therefore motivate them to articulate or substantiate their views more readily. In addition, our self-reported behavioral items captured general enactment orientations rather than audited, specific actions. While this approach enabled us to capture broad engagement tendencies, it may underestimate the attitude–behavior gap, as discrepancies between attitudes and specific enacted behaviors might be larger. Future studies could enrich these findings by incorporating additional data sources—such as observational reports or performance indicators—to reduce common-method bias and capture the real-world enactment of D&I principles more comprehensively.

Second, data were collected within a single Dutch organization. This design offers the advantage of holding the organizational context and the specifics of D&I policies constant while allowing comparisons across employee experiences. The large sample size (N = 2,639) and the diversity of respondents in gender, age, and tenure enhance the robustness of our observations. However, future research should explore whether similar patterns emerge in other sectors, organizations, or cultural contexts. For example, many responses in our study reflected limited awareness or familiarity with the D&I policy. In other settings—such as smaller organizations or those with more visible and actively promoted D&I policies—different patterns may emerge, including stronger affective, normative, or continuance motives for support or resistance (Herscovitch & Meyer, 2002).

Third, this study integrated three theoretical streams—change management, psychological antecedents of policy support, and behavior change research. While each framework is well-established, their combination provided an integrative lens to interpret the findings. As this is among the first attempts to assess motives underlying attitudinal and behavioral support for D&I policies, our results suggest this approach may be promising. In particular, we applied the IMOC, CLT, and SIT as a conceptual lens and a hypothesis-generating framework to better understand the support profiles and their underlying motives, rather than as a directly tested model. Future research could build on these insights by using validated measures of psychological need fulfillment to test pathways linking motives, attitudes, and engagement more precisely.

Finally, although our results might imply that “walking the talk”—combining attitudinal endorsement and behavioral enactment—is most likely to foster policy effectiveness, this warrants empirical examination. Prior work on commitment (Meyer et al., 2002) raises the question of whether championing behaviors indeed lead to more successful implementation than mere compliance. In the practical implications section, we discuss how organizations can ‘dance’ with the various D&I support clusters, as each may offer valuable insights for more effective policy. Future research could further investigate how different support groups respond to tailored strategies and how effective these are in enhancing D&I outcomes.

Conclusion

This study offers a psychologically grounded framework for understanding how and why employees and managers (do not) support organizational D&I policies. By disentangling attitude from behavior and combining survey and open-ended data, we move beyond reductive and unidimensional notions of support versus resistance. D&I policy support is multidimensional, often shaped by knowledge and structural factors—not merely ideology. Rather than viewing resistance as rejection, organizations might see it as an invitation to engage and adapt. As the metaphor of “dancing with resistance” suggests, the goal is not to overcome resistance, but to move with it, to understand what conditions enable meaningful engagement.

Conflicts of Interest

The authors declare no competing interests.

Acknowledgements

This research was financially supported by the Goldschmeding Foundation. We want to thank Melissa Vink for her assistance with coding the open-ended responses.

Data Availability Statement

Because the dataset contains sensitive information collected as part of an ongoing monitor, the full data cannot be made publicly available. Data are available from the authors upon reasonable request for verification purposes.

Supplementary Materials

The supplementary materials can be found here.

Author Contributions

Y.B., J.v.d.T., and N.E. designed the study and collected the data. Y.B. curated the dataset, and conducted the analyses. Y.B. drafted the introduction, methods, and discussion sections. J.v.d.T. and N.E. provided conceptual guidance, supervision, and critical revisions. All authors contributed to reviewing and editing the manuscript and approved the final version.

Endnotes

[1] The survey included additional measures that were not analyzed in the present manuscript because the data collection was part of a broader research project. A full overview of these measures is provided in Supplement E.

Readers of this article also read
Research Article

Partisan forgiveness of political leadership in the 2024 UK general election: Are there limits to transgression credit?

by Fanny Lalot & Dominic Abrams
Research Article

When it doesn’t get better: Leaning into minoritized identity to brace for decline

by Thomas A. Morton & Jessica Salvatore
Review

Weaponising the past: An extended SIMCA model for how social identity and collective memory shape variation in collective action responses to democratic backsliding

by Neil Lavie-Driver & Sander van der Linden
Research Article

War, what is it good for? Propaganda, value-instantiating beliefs, war support and resistance in Russia

by Vladimir Ponizovskiy, Marie Isabelle Weißflog, Evgeny Osin, & Lusine Grigoryan
Review

Race, memory, and colorblindness: Critical history and deconstructing United States democracy

by Michael J. Perez, Adam J. Beam, & Payton A. Small
Research Article

The politics of well-being during democratic backsliding: How partisan affiliation and support for government actions relate to happiness and life satisfaction

by Deborah J. Wu, Kyle F. Law, Stylianos Syropoulos, & Sylvia P. Perry
Research Article

Understanding public responses to counter-protests disrupting social change movements

by Hema Preya Selvanathan et al.
Research Article

Stigma-based solidarity betrayal: Implications for resistance to the rise of ethno-nationalism in the U.S.

by Crystal Shackleford, Maya Rabinowitz, & Jennifer A. Richeson
Editor Curated

Frequently Asked Questions

  • What is the core contribution of this study to understanding D&I policy support?

    Short answer: It shows D&I support is not just about attitudes—it’s also about behavior and the motives behind it. The study by Bokern et al. (2026) frames support as a set of five profiles that combine both attitudes and actions: Champions, Bystanders, Ambivalents, Reluctants, and Opponents. Using mixed methods, the authors link these profiles to five distinct reasoning patterns (e.g., unawareness, symbolic endorsement, advocacy-oriented critique). This approach moves beyond a simple “for vs. against” lens and reveals why people may endorse D&I in principle yet fail to act, or act while remaining skeptical. The framework helps organizations diagnose breakpoints between intended policies and real-world implementation.

  • How were the five D&I support profiles identified, and what do they mean?

    According to Bokern et al. (2026), k-means clustering on attitudinal and behavioral measures of D&I policy support yielded five profiles:

    1. Champions: high attitudes, high behavior.
    2. Bystanders: high attitudes, low behavior.
    3. Ambivalents: moderate on both.
    4. Reluctants: low attitudes, high behavior.
    5. Opponents: low on both.

    These profiles capture the attitude–behavior gap that often appears in socially sensitive domains. Reliability was strong (α=.90 attitudinal; α=.88 behavioral), and profiles were robust when policy awareness was added as a dimension. The taxonomy helps target interventions to specific barriers—for example, enhancing mastery for Bystanders or strengthening perceived meaning for Reluctants.

  • What reasoning patterns explain why employees support or resist D&I policies?

    Bokern et al. (2026) report five latent reasoning patterns from open-ended responses:

    1. Expressing Unawareness (29%).
    2. Reporting Inaccessibility (26%).
    3. Signaling Symbolic Support (19%).
    4. Critiquing Policy from an Advocacy Perspective (18%).
    5. Rejecting D&I Based on Meritocratic Beliefs (9%).

    These patterns map meaningfully onto the profiles (p<.001). For instance, Bystanders more often voiced symbolic support, Reluctants offered constructive critiques focused on implementation, and Opponents showed more unawareness and meritocratic rejection. The study emphasizes that not all resistance is ideological; it can reflect unclear expectations, limited access, or doubts about policy efficacy.

  • Do managers and minority-group members differ in their D&I support patterns?

    Yes. The study by Bokern et al. (2026) finds managers are overrepresented among Champions and Reluctants and underrepresented among Ambivalents and Opponents (p<.001). Managers more often display symbolic support and advocacy-oriented critique, suggesting higher engagement but also practical scrutiny of implementation. Employees with perceived minority status were more likely to fall into critical or resistant profiles and to offer advocacy-oriented critique (clusters: p<.001; reasoning: p<.001). This indicates that lived experiences and role expectations shape both how D&I is evaluated and how people act, underscoring the need for tailored strategies across organizational levels and groups.

  • What practical steps can organizations take to improve D&I policy uptake?

    Building on Bokern et al. (2026), organizations should tailor actions to each profile:

    1. Ambivalents: clarify and locate the policy, simplify access, and communicate expectations.
    2. Bystanders: translate values into concrete behaviors, give examples, and provide tools to build mastery.
    3. Reluctants: involve them in co-design and address concerns about scope and effectiveness to strengthen perceived meaning.
    4. Opponents: set clear norms and rationales, and focus on minimum behavioral standards while engaging respectfully.
    5. Champions: empower as ambassadors and recognize contributions.

    Complementary moves include leadership modeling, transparent metrics, and feedback loops. The goal is to convert abstract endorsement into sustained, actionable engagement.

References

Agresti, A. (2007). An introduction to categorical data analysis (Vol. 423). Wiley-Blackwell. https://doi.org/10.1002/0470114754

Ajzen, I. (1991). The theory of planned behavior. Organizational Behavior and Human Decision Processes, 50(2), 179–211. https://doi.org/10.1016/0749-5978(91)90020-T

Armenakis, A. A., & Bedeian, A. G. (1999). Organizational change: A review of theory and research in the 1990s. Journal of Management25(3), 293-315. https://doi.org/10.1177/014920639902500303

Armenakis, A. A., Harris, S. G., & Feild, H. S. (1999). Paradigms in organizational change: Change agent and change target perspectives. In R. Golembiewski (Ed.), Handbook of organizational behavior (pp. 631– 658). New York: Marcel Dekker. https://doi.org/10.4324/9781482290011-22

ATLAS.ti Scientific Software Development GmbH. (2023). ATLAS.ti Mac (version 23.2.1) [Qualitative data analysis software]. https://atlasti.com

Avery, D. R. (2011). Support for diversity in organizations: A theoretical exploration of its origins and offshoots. Organizational Psychology Review1(3), 239-256. https://doi.org/10.1177/2041386611402115

Bell, D. A. (1980). Brown v. Board of Education and the interest-convergence dilemma. Harvard Law Review, 93(3), 518–533. https://doi.org/10.2307/1340546

Blommaert, L., & Coenders, M. (2024). Understanding public support for workplace diversity and antidiscrimination policies in Europe. Frontiers in Sociology9, 1256751. https://doi.org/10.3389/fsoc.2024.1256751

Boeije, H. (2010). Analysis in qualitative research. Sage Publications Ltd. https://doi.org/10.5785/26-2-24

Bokern, Y. N. A., Van der Toorn, J., & Ellemers, N. (2025). Beyond talking the talk: Managerial D&I policy support and perceived inclusive organizational climate. [Manuscript submitted for publication].

Bowen, D. E., & Ostroff, C. (2004). Understanding HRM–firm performance linkages: The role of the “strength” of the HRM system. Academy of Management Review29(2), 203-221. https://doi.org/10.5465/amr.2004.12736076

Çelik, S., & Çelik, G. (2017). Aiming to connect: The business case for diversity in public organizations in the Netherlands. Public Money & Management37(7), 499-506. https://doi.org/10.1080/09540962.2017.1372108

Cialdini, R. B., Reno, R. R., & Kallgren, C. A. (1990). A focus theory of normative conduct: Recycling the concept of norms to reduce littering in public places. Journal of Personality and Social Psychology, 58(6), 1015–1026. https://doi.org/10.1037/0022-3514.58.6.1015

Deci, E. L., & Ryan, R. M. (1985). Intrinsic motivation and self-determination in human behavior. Plenum Press. https://doi.org/10.1007/978-1-4899-2271-7

Dixon, J., Durrheim, K., Tredoux, C. G., Tropp, L. R., Clack, B., Eaton, L., & Quayle, M. (2010). Challenging the stubborn core of opposition to equality: Racial contact and policy attitudes. Political Psychology31, 831–855. https://doi.org/10.1111/j.1467-9221.2010.00792.x

Dobbin, F., & Kalev, A. (2016). Why diversity programs fail, Harvard Business Review (Vol. 94), pp. 1–10. Harvard Business Publishing.

Dobbin, F., & Kalev, A. (2022). Getting to diversity: What works and what doesn’t. Cambridge, MA: Harvard University Press. https://doi.org/10.4159/9780674290051-014

Dobbin, F., Schrage, D., & Kalev, A. (2015). Rage against the iron cage: The varied effects of bureaucratic personnel reforms on diversity. American Sociological Review80(5), 1014-1044. https://doi.org/10.1177/0003122415596416

Dover, T. L., Major, B., & Kaiser, C. R. (2016). Members of high-status groups are threatened by pro-diversity organizational messages. Journal of Experimental Social Psychology62, 58-67. https://doi.org/10.1016/j.jesp.2015.10.006

Ellemers, N. (2017). Morality and the regulation of social behavior: Groups as moral anchors. Psychology Press. https://doi.org/10.4324/9781315661322

Ford, J. D., Ford, L. W., & D’amelio, A. (2008). Resistance to change: The rest of the story. Academy of Management Review33(2), 362-377. https://doi.org/10.5465/amr.2008.31193235

Gana, K., & Broc, G. (2019). Structural Equation Modeling with Lavaan. John Wiley & Sons, Inc. https://doi.org/10.1002/9781119579038

Gündemir, S., Kanitz, R., Rink, F., Hoever, I. J., & Slepian, M. L. (2024). Beneath the surface: Resistance to diversity, equity, and inclusion (DEI) initiatives in organizations. Current Opinion in Psychology, 101922. https://doi.org/10.1016/j.copsyc.2024.101922

Hagenaars, J. A., & McCutcheon, A. L. (2002). Applied latent class analysis (Hagenaars J. A., McCutcheon A. L., Eds.). Cambridge, UK: Cambridge University Press. https://doi.org/10.1017/CBO9780511499531

Harrison, D. A., Kravitz, D. A., Mayer, D. M., Leslie, L. M., & Lev-Arey, D. (2006). Understanding attitudes toward affirmative action programs in employment: Summary and meta-analysis of 35 years of research. Journal of Applied Psychology91(5), 1013-1036. https://doi.org/10.1037/0021-9010.91.5.1013

Herscovitch, L., & Meyer, J. P. (2002). Commitment to organizational change: Extension of a three-component model. Journal of Applied Psychology87(3), 474-487. https://doi.org/10.1037//0021-9010.87.3.474

Higgins, E. T., Shah, J., & Friedman, R. (1997). Emotional responses to goal attainment: Strength of regulatory focus as moderator. Journal of Personality and Social Psychology, 72(3), 515–525. https://doi.org/10.1037/0022-3514.72.3.515

Hobman, E. V., Bordia, P., & Gallois, C. (2004). Perceived dissimilarity and work group involvement: The moderating effects of group openness to diversity. Group & Organization Management29(5), 560-587. https://doi.org/10.1177/1059601103254269

Iyer, A. (2022). Understanding advantaged groups’ opposition to diversity, equity, and inclusion (DEI) policies: The role of perceived threat. Social and Personality Psychology Compass16(5), e12666. https://doi.org/10.1111/spc3.12666

Iyer, A., & Ryan, M. K. (2009). Why do men and women challenge gender discrimination in the workplace? The role of group status and in‐group identification in predicting pathways to collective action. Journal of Social Issues65(4), 791-814. https://doi.org/10.1111/j.1540-4560.2009.01625.x

Jaffé, M. E., Rudert, S. C., & Greifeneder, R. (2019). You should go for diversity, but I’d rather stay with similar others: Social distance modulates the preference for diversity. Journal of Experimental Social Psychology, 85, 103881. https://doi.org/10.1016/j.jesp.2019.103881

Jansen, W. S., van der Toorn, J., Bokern, Y. N. A., & Ellemers, N. (2024). Shades of support: An empirical assessment of D&I policy support in organizations. Journal of Applied Social Psychology54(4), 221-229. https://doi.org/10.1111/jasp.13025

Jetten, J., Spears, R., & Postmes, T. (2004). Intergroup distinctiveness and differentiation: a meta-analytic integration. Journal of personality and social psychology86(6), 862-879. https://doi.org/10.1037/0022-3514.86.6.862

Kaiser, C. R., & Major, B. (2006). A social psychological perspective on perceiving and reporting discrimination. Law & Social Inquiry31(4), 801-830. https://doi.org/10.1111/j.1747-4469.2006.00036.x

Kalev, A., Dobbin, F., & Kelly, E. (2006). Best practices or best guesses? Assessing the efficacy of corporate affirmative action and diversity policies. American sociological review71(4), 589-617. https://doi.org/10.1177/000312240607100404

Kamarova, S., Gagné, M., Holtrop, D., & Dunlop, P. D. (2025). Integrating behavior and organizational change literatures to uncover crucial psychological mechanisms underlying the adoption and maintenance of organizational change. Journal of Organizational Behavior46(2), 263-287. https://doi.org/10.1002/job.2832

Kanitz, R., Reinwald, M., Gonzalez, K., Burmeister, A., Song, Y., & Hoegl, M. (2024). Supportive, resistant, or both? A person-centric view on employee responses to diversity initiatives. Journal of Applied Psychology, 109(10), 1635–1658. https://doi.org/10.1037/apl0001190

Knowles, E. D., Lowery, B. S., Chow, R. M., & Unzueta, M. M. (2014). Deny, distance, or dismantle? How white Americans manage a privileged identity. Perspectives on Psychological Science, 9(6), 594–609. https://doi.org/10.1177/1745691614554658

Leslie, L. M. (2019). Diversity initiative effectiveness: A typological theory of unintended consequences. Academy of Management Review44(3), 538-563. https://doi.org/10.5465/amr.2017.0087

Mahfud, Y., Badea, C., Verkuyten, M., & Reynolds, K. (2018). Multiculturalism and attitudes toward immigrants: The impact of perceived cultural distance. Journal of Cross-Cultural Psychology49(6), 945-958. https://doi.org/10.1177/0022022117730828

Maio, G. R., Verplanken, B., & Haddock, G. (2018). The psychology of attitudes and attitude change. SAGE Publications. https://doi.org/10.4135/9781446214299

McCrory, M. N., & Thomas, S. A. (2025). Cluster metric sensitivity to irrelevant features. In N. E. Mastorakis, I. J. Rudas, & Y. S. Shmaliy (Eds.), Computational problems in science and engineering II (pp. 85–95). Cham: Springer Nature Switzerland. https://doi.org/10.1007/978-3-031-78416-3_7

McHugh, M. L. (2012). Interrater reliability: The kappa statistic. Biochemia Medica, 22(3), 276–282. https://doi.org/10.11613/BM.2012.031

McKinsey & Company. (2020). Diversity wins: How inclusion matters. https://www.mckinsey.com/featured-insights/diversity-and-inclusion/diversity-wins-how-inclusion-matters

McKinsey & Company. (2023). Corporate commitments to racial justice: An update. https://www.mckinsey.com/institute-for-economic-mobility/our-insights/corporate-commitments-to-racial-justice-an-update

Meyer, J. P., Stanley, D. J., Herscovitch, L., & Topolnytsky, L. (2002). Affective, continuance, and normative commitment to the organization: A meta-analysis of antecedents, correlates, and consequences. Journal of Vocational Behavior61(1), 20-52. https://doi.org/10.1006/jvbe.2001.1842

National Coordinator against Discrimination and Racism. (2022). National Program against Discrimination and Racism 2022. https://www.bureauncdr.nl/binaries/bureauncdr/documenten/nationale-programmas/2023/12/12/national-program-2022—english/National+Program+against+Discrimination+and+Racism+2022+-+English.pdf

Ng, E., Fitzsimmons, T., Kulkarni, M., Ozturk, M. B., April, K., Banerjee, R., & Muhr, S. L. (2025). The anti-DEI agenda: navigating the impact of Trump’s second term on diversity, equity and inclusion. Equality, Diversity and Inclusion: An International Journal44(2), 137-150. https://doi.org/10.1108/EDI-02-2025-0116

Nishii, L. H., Khattab, J., Shemla, M., & Paluch, R. M. (2018). A multi-level process model for understanding diversity practice effectiveness. Academy of Management Annals12(1), 37-82. https://doi.org/10.5465/annals.2016.0044

Nishii, L. H., & Wright, P. M. (2008). Variability within organizations: Implications for strategic human resources management. In D. B. Smith (Ed.), The people make the place: Dynamic linkages between individuals and organizations (pp. 225–248). Taylor & Francis Group/Lawrence Erlbaum Associates. https://doi.org/10.4324/9780203809549

Patton, M. Q. (2014). Qualitative research & evaluation methods: Integrating theory and practice (4th ed.). Sage Publications.

Petty, R. E., & Cacioppo, J. T. (1986). The elaboration likelihood model of persuasion. In Communication and persuasion (pp. 1–24). Springer. https://doi.org/10.1007/978-1-4612-4964-1_1

Pew Research Center. (2023). Diversity, equity and inclusion in the workplace. https://www.pewresearch.org/social-trends/2023/05/17/diversity-equity-and-inclusion-in-the-workplace/

Plaut, V. C., Garnett, F. G., Buffardi, L. E., & Sanchez-Burks, J. (2011). “What about me?” Perceptions of exclusion and Whites’ reactions to multiculturalism. Journal of Personality and Social Psychology101(2), 337. https://doi.org/10.1037/a0022832

Podsakoff, P. M., MacKenzie, S. B., Lee, J.-Y., & Podsakoff, N. P. (2003). Common method biases in behavioral research: A critical review of the literature and recommended remedies. Journal of Applied Psychology, 88(5), 879–903. https://doi.org/10.1037/0021-9010.88.5.879

Rattan, A., & Ambady, N. (2013). Diversity ideologies and intergroup relations: An examination of colorblindness and multiculturalism. European Journal of Social Psychology43(1), 12-21. https://doi.org/10.1002/ejsp.1892

R Core Team. (2023). R: A Language and Environment for Statistical Computing. Vienna. R Foundation for Statistical Computing. Available at: https://www.R-project.org/

Rios, K., & Wynn, A. N. (2016). Engaging with diversity: Framing multiculturalism as a learning opportunity reduces prejudice among high White American identifiers. European Journal of Social Psychology46(7), 854-865. https://doi.org/10.1002/ejsp.2196

Rosseel, Y. (2012). lavaan: An R Package for Structural Equation Modeling. Journal of Statistical Software48(2), 1–36. https://doi.org/10.18637/jss.v048.i02

Şahin, O., Van der Toorn, J., Jansen, W. S., Boezeman, E. J., & Ellemers, N. (2019). Looking beyond our similarities: How perceived (in) visible dissimilarity relates to feelings of inclusion at work. Frontiers in Psychology10, 575. https://doi.org/10.3389/fpsyg.2019.00575

Satorra, A., & Bentler, P. M. (1994). Corrections to test statistics and standard errors in covariance structure analysis. In von Eye, A., & Clogg, C.C. (Eds.), Latent variables analysis: Applications for developmental research (pp. 399–419). Sage Publications, Inc.

Scarborough, W. J., Lambouths, D. L., & Holbrook, A. L. (2019). Support of workplace diversity policies: The role of race, gender, and beliefs about inequality. Social Science Research79, 194-210. https://doi.org/10.1016/j.ssresearch.2019.01.002

Sheeran, P., & Webb, T. L. (2016). The intention–behavior gap. Social and Personality Psychology compass10(9), 503-518. https://doi.org/10.1111/spc3.12265

Starck, J. G., Hurd, K., Perez, M. J., & Marshburn, C. K. (2024). Interest convergence and the maintenance of racial advantage: The case of diversity in higher education. Journal of Social Issues80(1), 272-307. https://doi.org/10.1111/josi.12606

Tajfel, H., & Turner, J. C. (1979). An integrative theory of intergroup conflict. In W. G. Austin & S. Worchel (Eds.), The social psychology of intergroup relations (pp. 33–47). Monterey, CA: Brooks/Cole.

Toma, C., Carter, A. B., & Phillips, K. W. (2025). Diversity? Great for Most Just Less So for Me: How Cognitive Abstraction Affects Diversity Attitudes and Choices. Behavioral Sciences15(5), 585. https://doi.org/10.3390/bs15050585

Tost, L. P., & Johnson, H. H. (2019). The prosocial side of power: How structural power over subordinates can promote social responsibility. Organizational Behavior and Human Decision Processes152, 25-46. https://doi.org/10.1016/j.obhdp.2019.04.004

Tourangeau, R., & Yan, T. (2007). Sensitive questions in surveys. Psychological Bulletin, 133(5), 859–883. https://doi.org/10.1037/0033-2909.133.5.859

Trope, Y., & Liberman, N. (2003). Temporal construal. Psychological Review, 110(3), 403–421. https://doi.org/10.1037/0033-295X.110.3.403

Trope, Y., & Liberman, N. (2010). Construal-level theory of psychological distance. Psychological Review, 117(2), 440–463. https://doi.org/10.1037/a0018963

Visser, C., Kingma, R., van der Toorn, J., & Ellemers, N. (2025). De Nederlandse Inclusiviteitsmonitor: Inzichten uit 2019–2024 [Netherlands Inclusivity Monitor: Insights from 2019–2024]. Nederlandse InclusiviteitsMonitor. https://www.nederlandseinclusiviteitsmonitor.nl/benchmark

Wasserman, I. C., Gallegos, P. V., & Ferdman, B. M. (2008). Dancing with resistance: Leadership challenges in fostering a culture of inclusion. In K. M. Thomas (Ed.), Diversity resistance in organizations: 175-200. New York: Taylor & Francis Group/Lawrence Erlbaum. https://doi.org/10.4324/9780203809761

Wet van 29 september 2021 tot wijziging van Boek 2 van het Burgerlijk Wetboek in verband met het evenwichtiger maken van de verhouding tussen het aantal mannen en vrouwen in het bestuur en de raad van commissarissen van grote naamloze en besloten vennootschappen [Inclusion Quota and Target Figures Act]. (2021). (Staatsblad 2021, 495). Retrieved September 19, 2025, from https://wetten.overheid.nl/BWBR0045731/2022-01-01

Whitley, B. E., & Webster, G. D. (2019). The relationships of intergroup ideologies to ethnic prejudice: A meta-analysis. Personality and Social Psychology Review23(3), 207-237. https://doi.org/10.1177/1088868318761423

Wright, P. M., & Nishii, L. H. (2013). Strategic HRM and organizational behaviour: Integrating multiple levels of analysis. In: J. Paauwe, D.E. Guest & P.M. Wright. (eds). HRM & Performance. Achievements & Challenges. UK: Wiley Press. [pp. 97-110].

Yogeeswaran, K., & Dasgupta, N. (2014). The devil is in the details: Abstract versus concrete construals of multiculturalism differentially impact intergroup relations. Journal of Personality and Social Psychology106(5), 772-789. https://doi.org/10.1037/a0035830

Previous Post
How counter protests influence perceived suppression of freedom of speech and sypathy toward protesters

Understanding public responses to counter-protests disrupting social change movements

Next Post
Research on well-being and happiness among Republicans and Democrats

The politics of well-being during democratic backsliding: How partisan affiliation and support for government actions relate to happiness and life satisfaction