



When a stay is a switch: Discriminative control of response chunks determines preference during concurrent VI VI schedules

ORCID logo

Received: March 27, 2026. Accepted: June 30, 2026. Published: July 21, 2026. https://doi.org/10.56296/aip00058 · © 2026 The Author(s)

Author Details

: Vassar College

*Please address correspondence to J. Mark Cleaveland, macleaveland@vassar.edu, Vassar College, Box 298, 124 Raymond Avenue, Poughkeepsie, NY 12604, United States

Transparent Peer Review

The current article passed three rounds of peer review. The anonymous review report can be found here.

Abstract

We present evidence that changeover delays (CODs) can organize responding into response chunks and that the discriminative control of these units can contribute to observed preference during concurrent variable-interval (VI) VI schedules of reinforcement. Two experiments were conducted with pigeons. Both utilized multiple VI 30-s VI 60-s, VI 30-s VI 60-s schedules of reinforcement. One of the VI 30-s schedules was further paired with a 2.5-s changeover delay (COD). After training, unreinforced probes trials were conducted that paired the two stimuli associated with the VI 30-s schedules. In both experiments, during training, birds showed a preference for the VI 30-s schedule over the VI 60-s schedule. This preference was more extreme for the schedule pair in which a COD was programmed with the VI 30-s schedule. Further, an analysis of molecular response patterns found that the application of a COD led to discrete bursts of rapid responding, but only to the VI 30-s schedule to which a COD had been assigned. Finally, during probes, we observed a peck-based preference for the VI 30-s stimulus associated with a COD only when the probe procedure appeared to preserve discriminative control over the trained response structure.
Editor Curated

Key Takeaways

  • When pigeons switched into a variable-interval schedule that carried a 2.5-second changeover delay (VI 30COD), their responding organized into “switch bouts,” clusters of rapid pecks with very low switching. In Experiment 1, the peck-based preference for the VI 30COD schedule over its VI 60-s partner was more extreme than the preference the plain VI 30 schedule drew over its own VI 60-s partner (M = 0.85 vs. 0.70, t(6) = 3.98, p < .001). That apparent advantage disappeared when preference was measured by dwell time (M = 0.65 vs. 0.63, t(6) = .55, p = .59), suggesting the extra pecks reflected response structure rather than greater value.
  • The changeover delay reliably lengthened how long birds stayed at a schedule. The VI 30COD schedule produced significantly longer dwell times than the plain VI 30 schedule (12.3 s vs. 4.3 s, t(6) = 3.96, p < .001 in Experiment 1; 8.92 s vs. 4.66 s, t(6) = 8.44, p < .001 in Experiment 2), and the VI 60-s schedule paired with the COD showed the same lengthening relative to its counterpart (for example, 4.33 s vs. 2.98 s, t(6) = 3.06, p = .02 in Experiment 1). Birds were also far less likely to switch away during the first four seconds at the COD schedule, consistent with a cohesive response chunk forming right after entry.
  • Probe tests, which paired the two VI 30-s stimuli without reinforcement, gave inconsistent results across experiments. In Experiment 1, birds favored the plain VI 30 stimulus by roughly 2:1, and did so on both the response and dwell-time measures (M = 0.65 and 0.67 for the VI 30 stimulus). In Experiment 2, which used a traditional Findley procedure to preserve stimulus control, they instead favored the VI 30COD stimulus by close to 2:1 on the response measure (M = 0.62, SE = 0.07), while showing no dwell-time preference (M = 0.53, SE = 0.01). This indicates that whether the trained “switch bout” carries over to probes depends heavily on procedural stimulus control.

Introduction

A central issue for models of choice is the definition of the response unit. Switches and stays (Cleaveland, 2024; MacDonall, 2009), dwell times (Gibbon, 1995; Houston et al., 1995), bouts (Shull et al., 2004; Smith et al., 2014), and response sequences (Hinson & Staddon, 1983a, 1983b; Silberberg et al., 1978) have each been treated as units upon which reinforcement contingencies act. These alternatives need not be mutually exclusive. Reinforcement may not only assign value to stimuli or alternatives; it may also shape the behavioral units through which those alternatives are contacted. This latter process is often described as response chunking.

Evidence for Response Chunking

In the laboratory, behavior under both serial and concurrent schedules often shows clear temporal organization into response units larger than individual key pecks. In serial tasks, such units – often called chunks – emerge when stimuli are organized into meaningful groups, producing faster within-chunk response rates that are resistant to disruption. For example, Schwartz (1980, 1982) required pigeons to make exactly four responses to each of two lit keys. He found that out of the 70 possible correct sequences all pigeons settled on one sequence (LLLLRRRR). In further experiments he found that the integrity of the sequence as measured by internal response rate was unaffected by extinction and differential reinforcement. However, the latencies between complete sequences were affected by extinction and differential reinforcement. Similarly, Terrace (1991a, 1991b; Terrace & Chen, 1991) found evidence of response chunking when a pigeon was required to peck a particular sequence of stimuli which fell into two clear groups (for example, colors and shapes). Like Schwartz, Terrace demonstrated that pigeons trained to peck through a fixed series of visual stimuli exhibited response chunks – groups of responses within the sequence that were performed more quickly and with fewer errors than between-chunk transitions.

In free-operant concurrent schedules, similar evidence for response chunking is observed, although termed “bout formation.” When rats or pigeons are placed on concurrent variable-interval (VI) schedules, they tend not to distribute responses in a strictly alternating fashion but instead produce “bouts” – clusters of responses on one key before switching to the other. For example, Shull et al. (2004) quantified bout structure in nose pokes of a lit key by rats during tandem variable-interval, fixed ratio schedules of reinforcement. Log survivor plots of interresponse times (IRTs) showed that the rats tended to emit bouts of responding in which within-bout response structure was unaffected by overall reinforcer contingencies. Smith et al. (2014) extended these findings to pigeon pecking behavior under concurrent VI VI schedules of reinforcement. They suggested that bout length and bout initiation rates could be modeled as separable processes – one reflecting persistence once a bout begins, and the other reflecting the likelihood of starting a new bout.

Physiological research on habit formation has also encountered the phenomenon of response chunking. In instrumental tasks, early training correlates with increased activity in the dorsomedial, or associative striatum, and later training correlates with increased activity in the dorsolateral, or sensorimotor striatum (Balleine & Dickinson, 1998; Balleine & O’Doherty, 2010; Graybiel, 1998). This early-to-late training also seems to be accompanied by a consolidation of activity patterns into efficient, chunked sequences of behavior (O’Doherty et al., 2004). This behavioral change is closely correlated with changes in electrophysiological activity in the sensorimotor striatum. Namely, at the start of an instrumental task, recordings in the sensorimotor striatum show strong activity across the entirety of a trial. However, over time, this activity becomes concentrated at the start and finish of the task (Barnes et al., 2005; Fujii & Graybiel, 2003; Graybiel, 2008; Jog et al., 1999).

Implications for Reinforcement Models

Given the ample evidence of response chunking during instrumental procedures, modeling the choice behavior of animals under concurrent schedules of reinforcement requires an understanding of this process. To date, though, few if any models of choice concern themselves with the process or processes that might be determinative of the behavioral units on which the models depend. As mentioned at the start of the introduction, reinforcement models have tended to emphasize different fundamental behavioral units, but not the processes that might construct or assign credit to these units.

For example, Cleaveland’s (2024) active time model assumes that the basic units of choice are stay and switch responses associated, via reinforcement, with IRTs. That is, the model is conceptually akin to path integration in that it posits that an interoceptive cue – interresponse time – is a discriminative stimulus for action. Further, the model assumes that for concurrent VI VI procedures the units of choice are single “stay” and “switch” responses. MacDonall’s (2009) stay/switch model of reinforcement also suggests that the fundamental units of choice are “stay” and “switch” responses, but at a more molar level. MacDonall’s model distinguishes between responses that earn a reinforcement and those that obtain a reinforcement. Concurrent VI VI procedures are then characterized by the fact that a subject earns a reinforcement (i.e., spends time at a schedule) and obtains a reinforcement (i.e., emits the response that immediately produces the reinforcing outcome) in a particular way determined by the reinforcement schedule. That is, the nature of concurrent VI VI schedules is that the responses that earn a reinforcement can occur either at the alternate schedule – and then be obtained via a switch – or at the current schedule – and then be obtained via a stay.

Note, though, that the stay and switch units proposed by MacDonall (2009) are molar units that are composed of multiple individual responses, whereas the stay and switch units proposed by Cleaveland (2024) are molecular units composed of single responses. Despite the success with which each model accounts for their respective molar and molecular data sets, no understanding exists for how, whether, and under what conditions animals come to group individual responses into “stay” or “switch” units. More generally, this lack of understanding of how organisms come to structure and chunk their responding prevents any unification of molecular and molar models of action selection and choice. What is needed are accepted methodologies for studying response chunking.

Cod As Methodology for Studying Response Chunking

One potential methodology for studying response chunking in instrumental procedures is the changeover delay (COD). In concurrent schedules of reinforcement, a COD is often employed to decrease the reinforcement of switching behavior. After a switch, responses to the new choice are not reinforced until a delay elapses. So, with a COD of 2 s, regardless of whether a reinforcement has been scheduled to be delivered after switching into an alternative, it is held until the first response after the 2-s delay. In the laboratory, the use of CODs became popular as a method for controlling undesired reinforcement of switching behavior, given the finding that the rate of responding at a schedule of reinforcement matches the rate of reinforcement obtained at that schedule of reinforcement (Baum, 1974; Herrnstein, 1961). CODs were developed, then, as a means of controlling the “confound” of reinforced switching at the expense of “true” schedule-focused responding.

Increasingly, though, evidence has accumulated that indicates the employment of a COD is not a neutral methodology. Williams and Bell (1999) compared training with short versus long CODs and found that longer CODs reliably produced longer runs of responses on a single key. Although probe tests showed that overall preference remained tied to relative reinforcement rates at the concurrent VI VI schedules, Williams and Bell noted that CODs altered the temporal organization of responding, creating more extended stays even when reinforcement contingencies at the molar level were unchanged.

McDevitt and Bell (2013) further extended this work by manipulating COD duration in concurrent VI VI schedules and then conducting probe tests. They observed that longer CODs not only increased dwell times at the VI schedules but also generated a bias for the alternatives experienced under those longer CODs. This was shown to be true even when reinforcement rates were equalized in between the paired probe stimuli. This suggests that the longer dwell times produced by CODs were in turn brought under stimulus control and maintained independently of underlying rates of reinforcement.

Finally, Gomes-Ng et al. (2018) analyzed moment-to-moment choice using the concept of “preference pulses,” i.e., brief increases in preference for the just-selected alternative immediately after reinforcement. They showed that CODs amplified these pulses and increased dwell durations. Their analysis revealed two components to the COD effect: a structural component (reduced switching probability due to the temporal discounting of expected reinforcement) and a local reinforcement component (altered availability of reinforcers after a switch).

Taken together, these findings demonstrate that CODs do far more than simply reduce the likelihood that the first response to an alternative will be reinforced. They shape the form of switching, extend the temporal cohesion of stays, and can potentially impart discriminative stimulus control to longer visits.

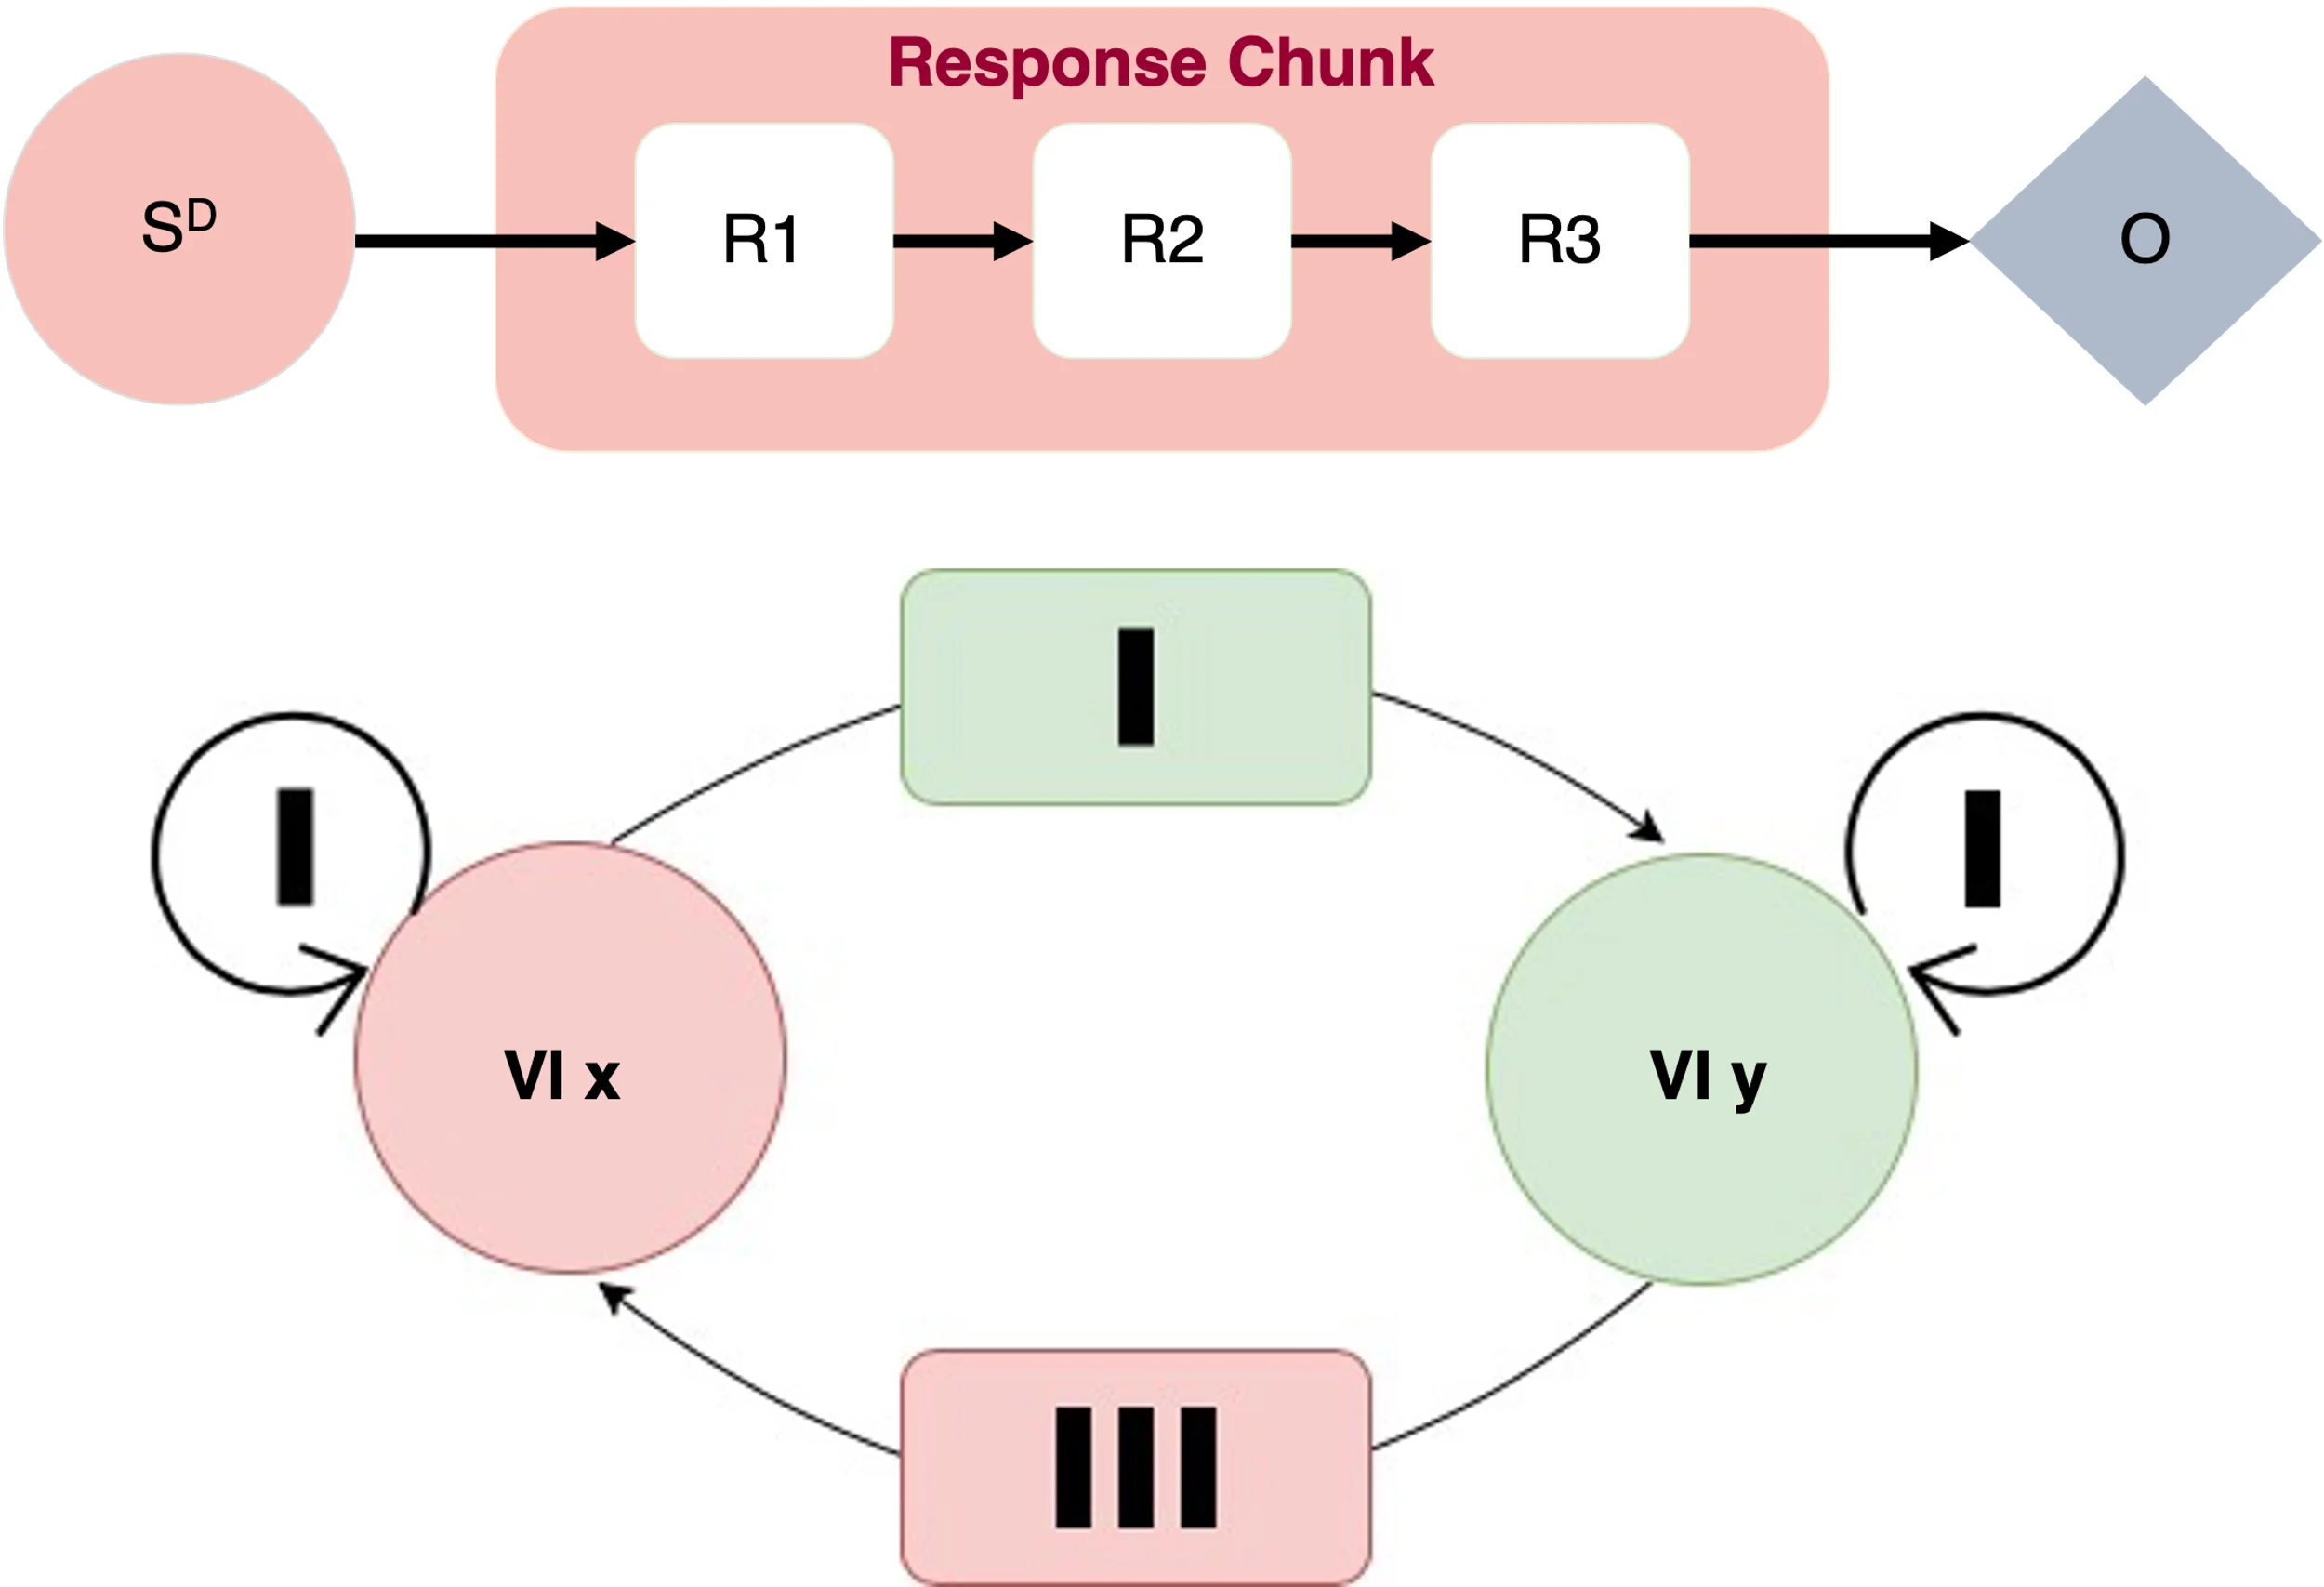
In other words, CODs are a potential methodology for exploring response chunking and are therefore a procedure that might allow models of choice behavior to incorporate response chunking into their formalizations. Figure 1 provides a simple example. Suppose a COD changes the qualitative nature of a switch response, transforming it from a single discrete event into a structured response chunk: a “switch bout.” Under this hypothesis, one might measure multiple individual responses (e.g., pecks, lever presses, etc.) but formally these responses would actually constitute a single response, albeit a temporally extended one with its own discriminative and reinforcing properties. As Figure 1 shows, if a “switch-bout” were to emerge during concurrent VI VI training, it would hold implications for expected measurements of preference. A measured 2:1 preference for one alternative over another would not necessarily indicate that the alternative had greater value; it could instead reflect the fact that one functional response unit contains more recorded pecks than the other.

Figure 1
Hypothetical Response Chunk: A “Switch Bout”

A conceptual diagram showing two panels illustrating response chunk formation in concurrent VI VI schedules. The top panel depicts a discriminative stimulus (S^D) leading through a "Response Chunk" of sequential responses (R1, R2, R3) to an outcome (O). The bottom panel shows two schedule states, "VI x" (pink) and "VI y" (green), connected by curved changeover arrows with self-loop stay arrows, using tally marks to represent response transitions between alternatives.

For the present experiments, we treat a “switch bout” as a candidate functional response unit (i.e., response chunk) that begins with a changeover response into a schedule and is followed by a short, cohesive run of schedule-key responses. Operationally, evidence for such a unit would consist of a cluster of short interresponse times (IRTs) and low switch probabilities immediately after entry into a schedule, followed by a transition point marked by an increased probability of either longer IRTs or switching away from that schedule. This criterion is used here as a working, exploratory definition for identifying whether a COD altered the organization of responding. Future work will be needed to specify bout boundaries prospectively, either by using an a priori IRT threshold or by fitting a model that estimates within-bout and between-bout response states.

Experiment 1

Experiment 1 sought to test the hypothesis outlined in Figure 1. The hypothesis rests on four core assumptions:

  1. That switches and stays are the response units that pigeons utilize in concurrent VI VI schedules of reinforcement (Cleaveland, 2024; MacDonall, 2009).
  2. That one of the outcomes of utilizing a changeover delay (COD) is to train a response chunk – what we will term in this paper a “switch bout” – in which multiple pecks constitute a single, functional switch response.
  3. Therefore, if two VI schedules are equivalent in programmed rate of reinforcement, but one has been paired with a COD, then that VICOD schedule will appear to be “preferred” (see Figure 1).
  4. The COD-caused switch bout will also correspond to differences in molecular response variables such as response rate and response ballistics.

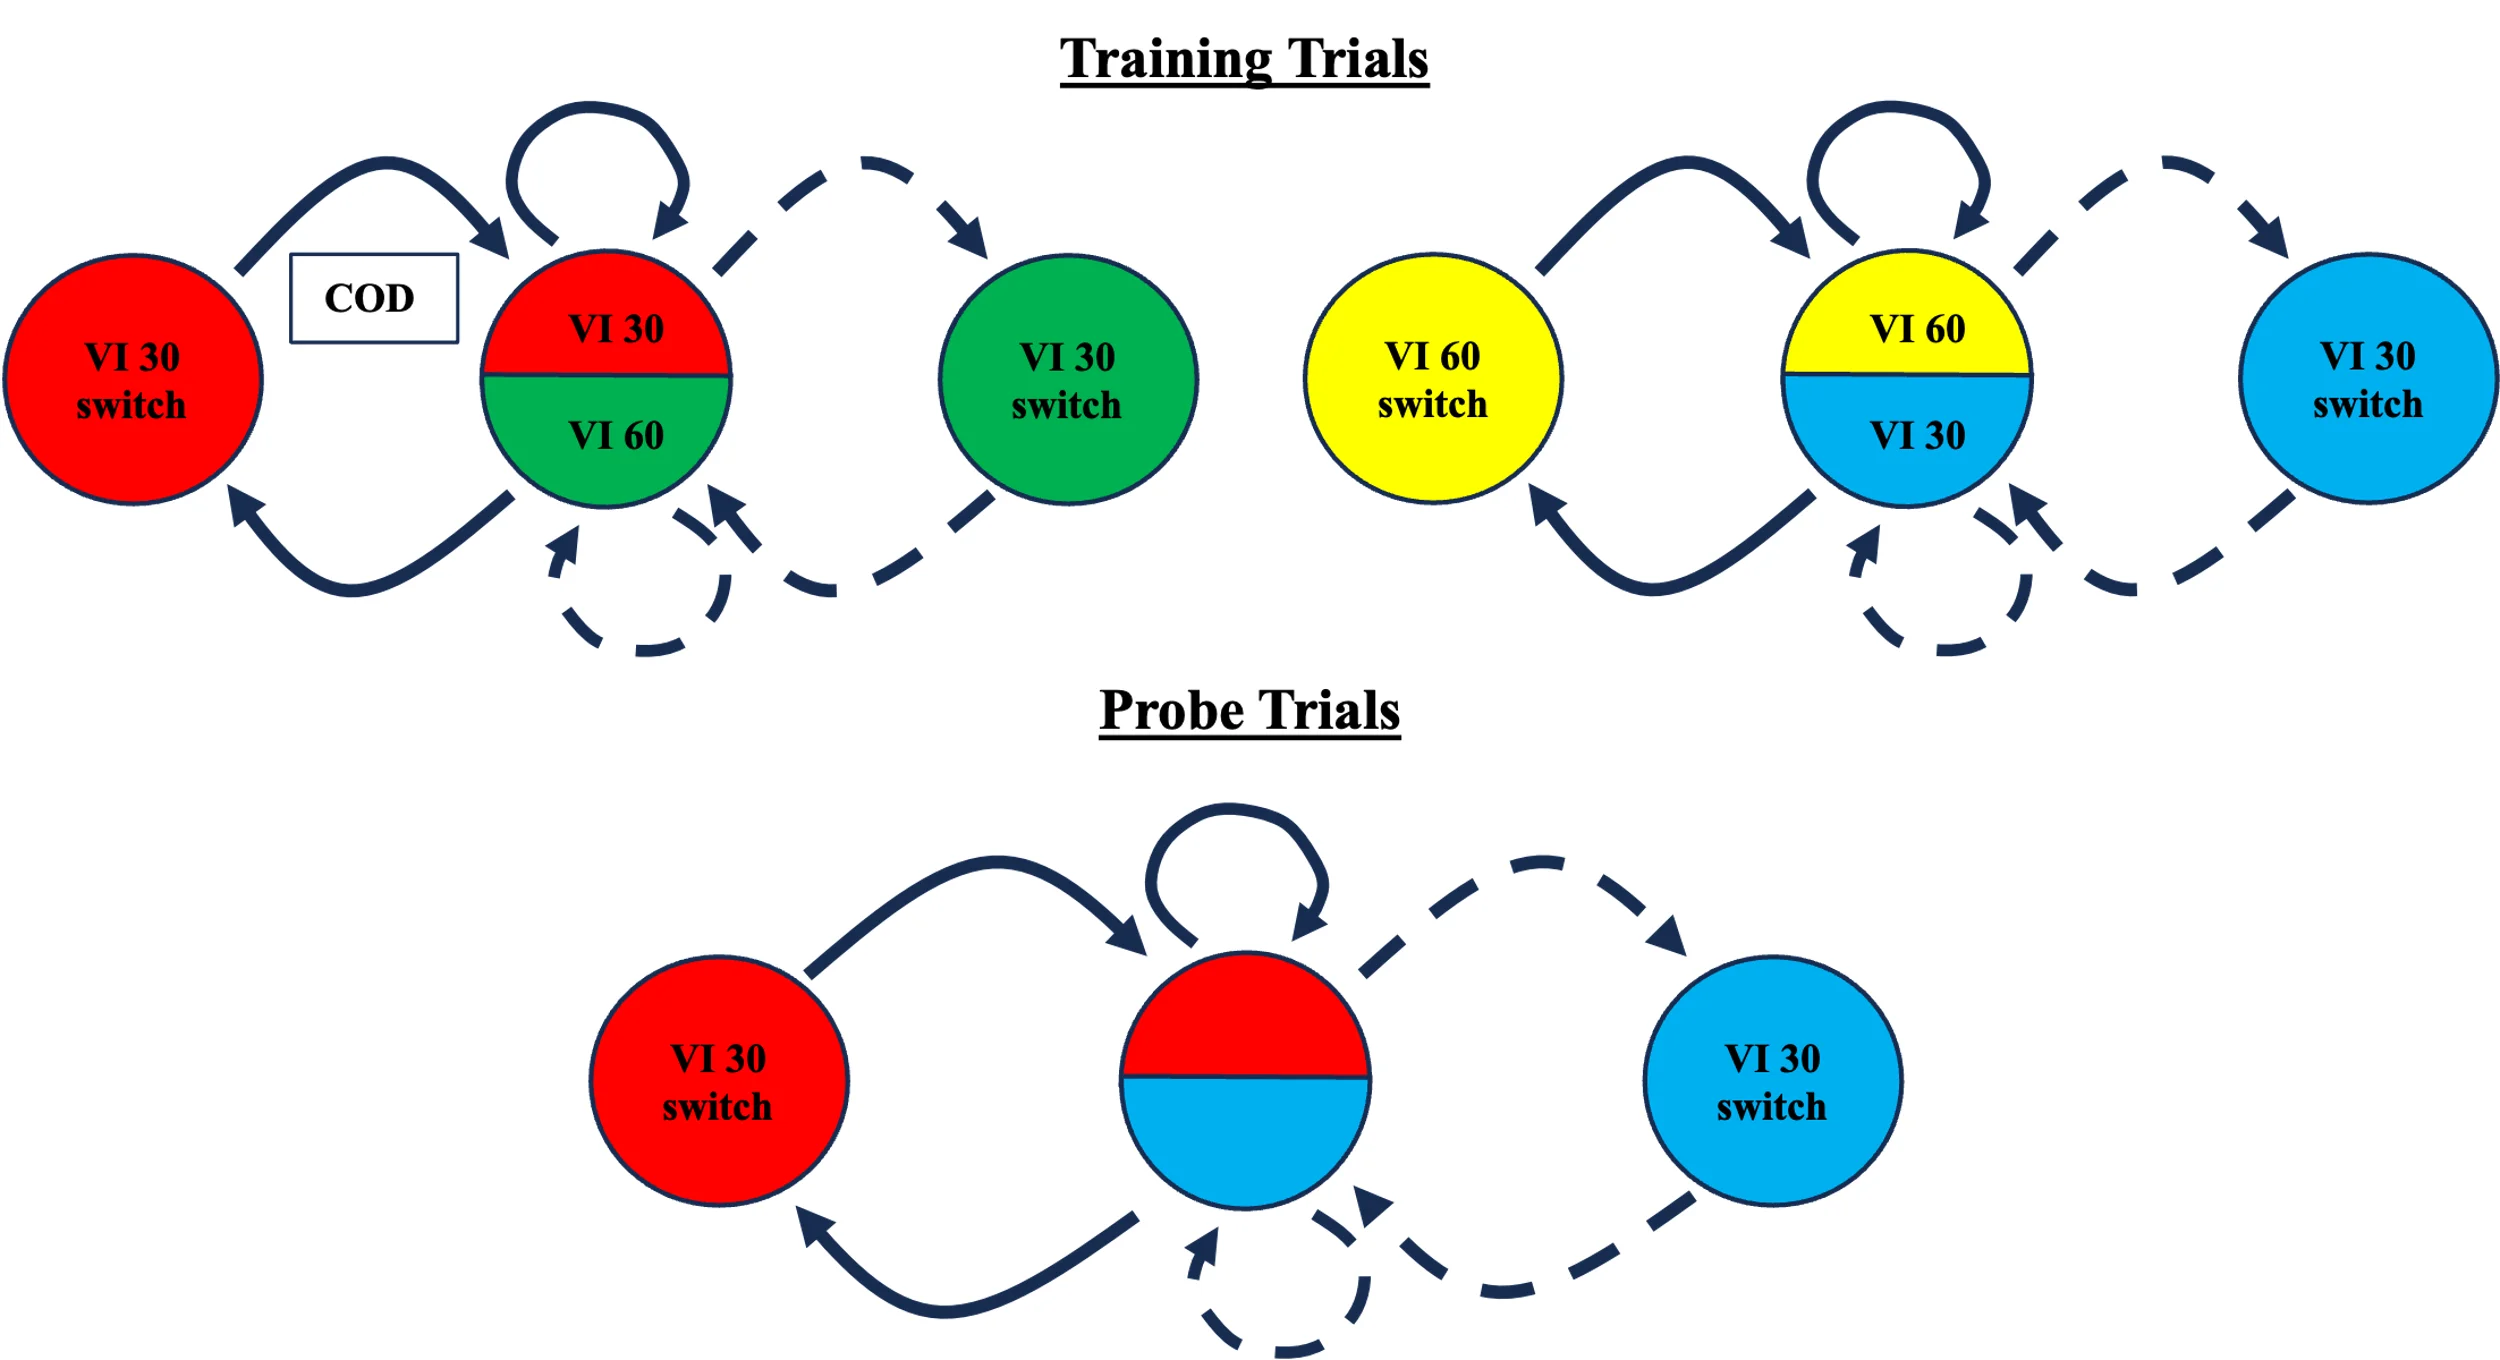
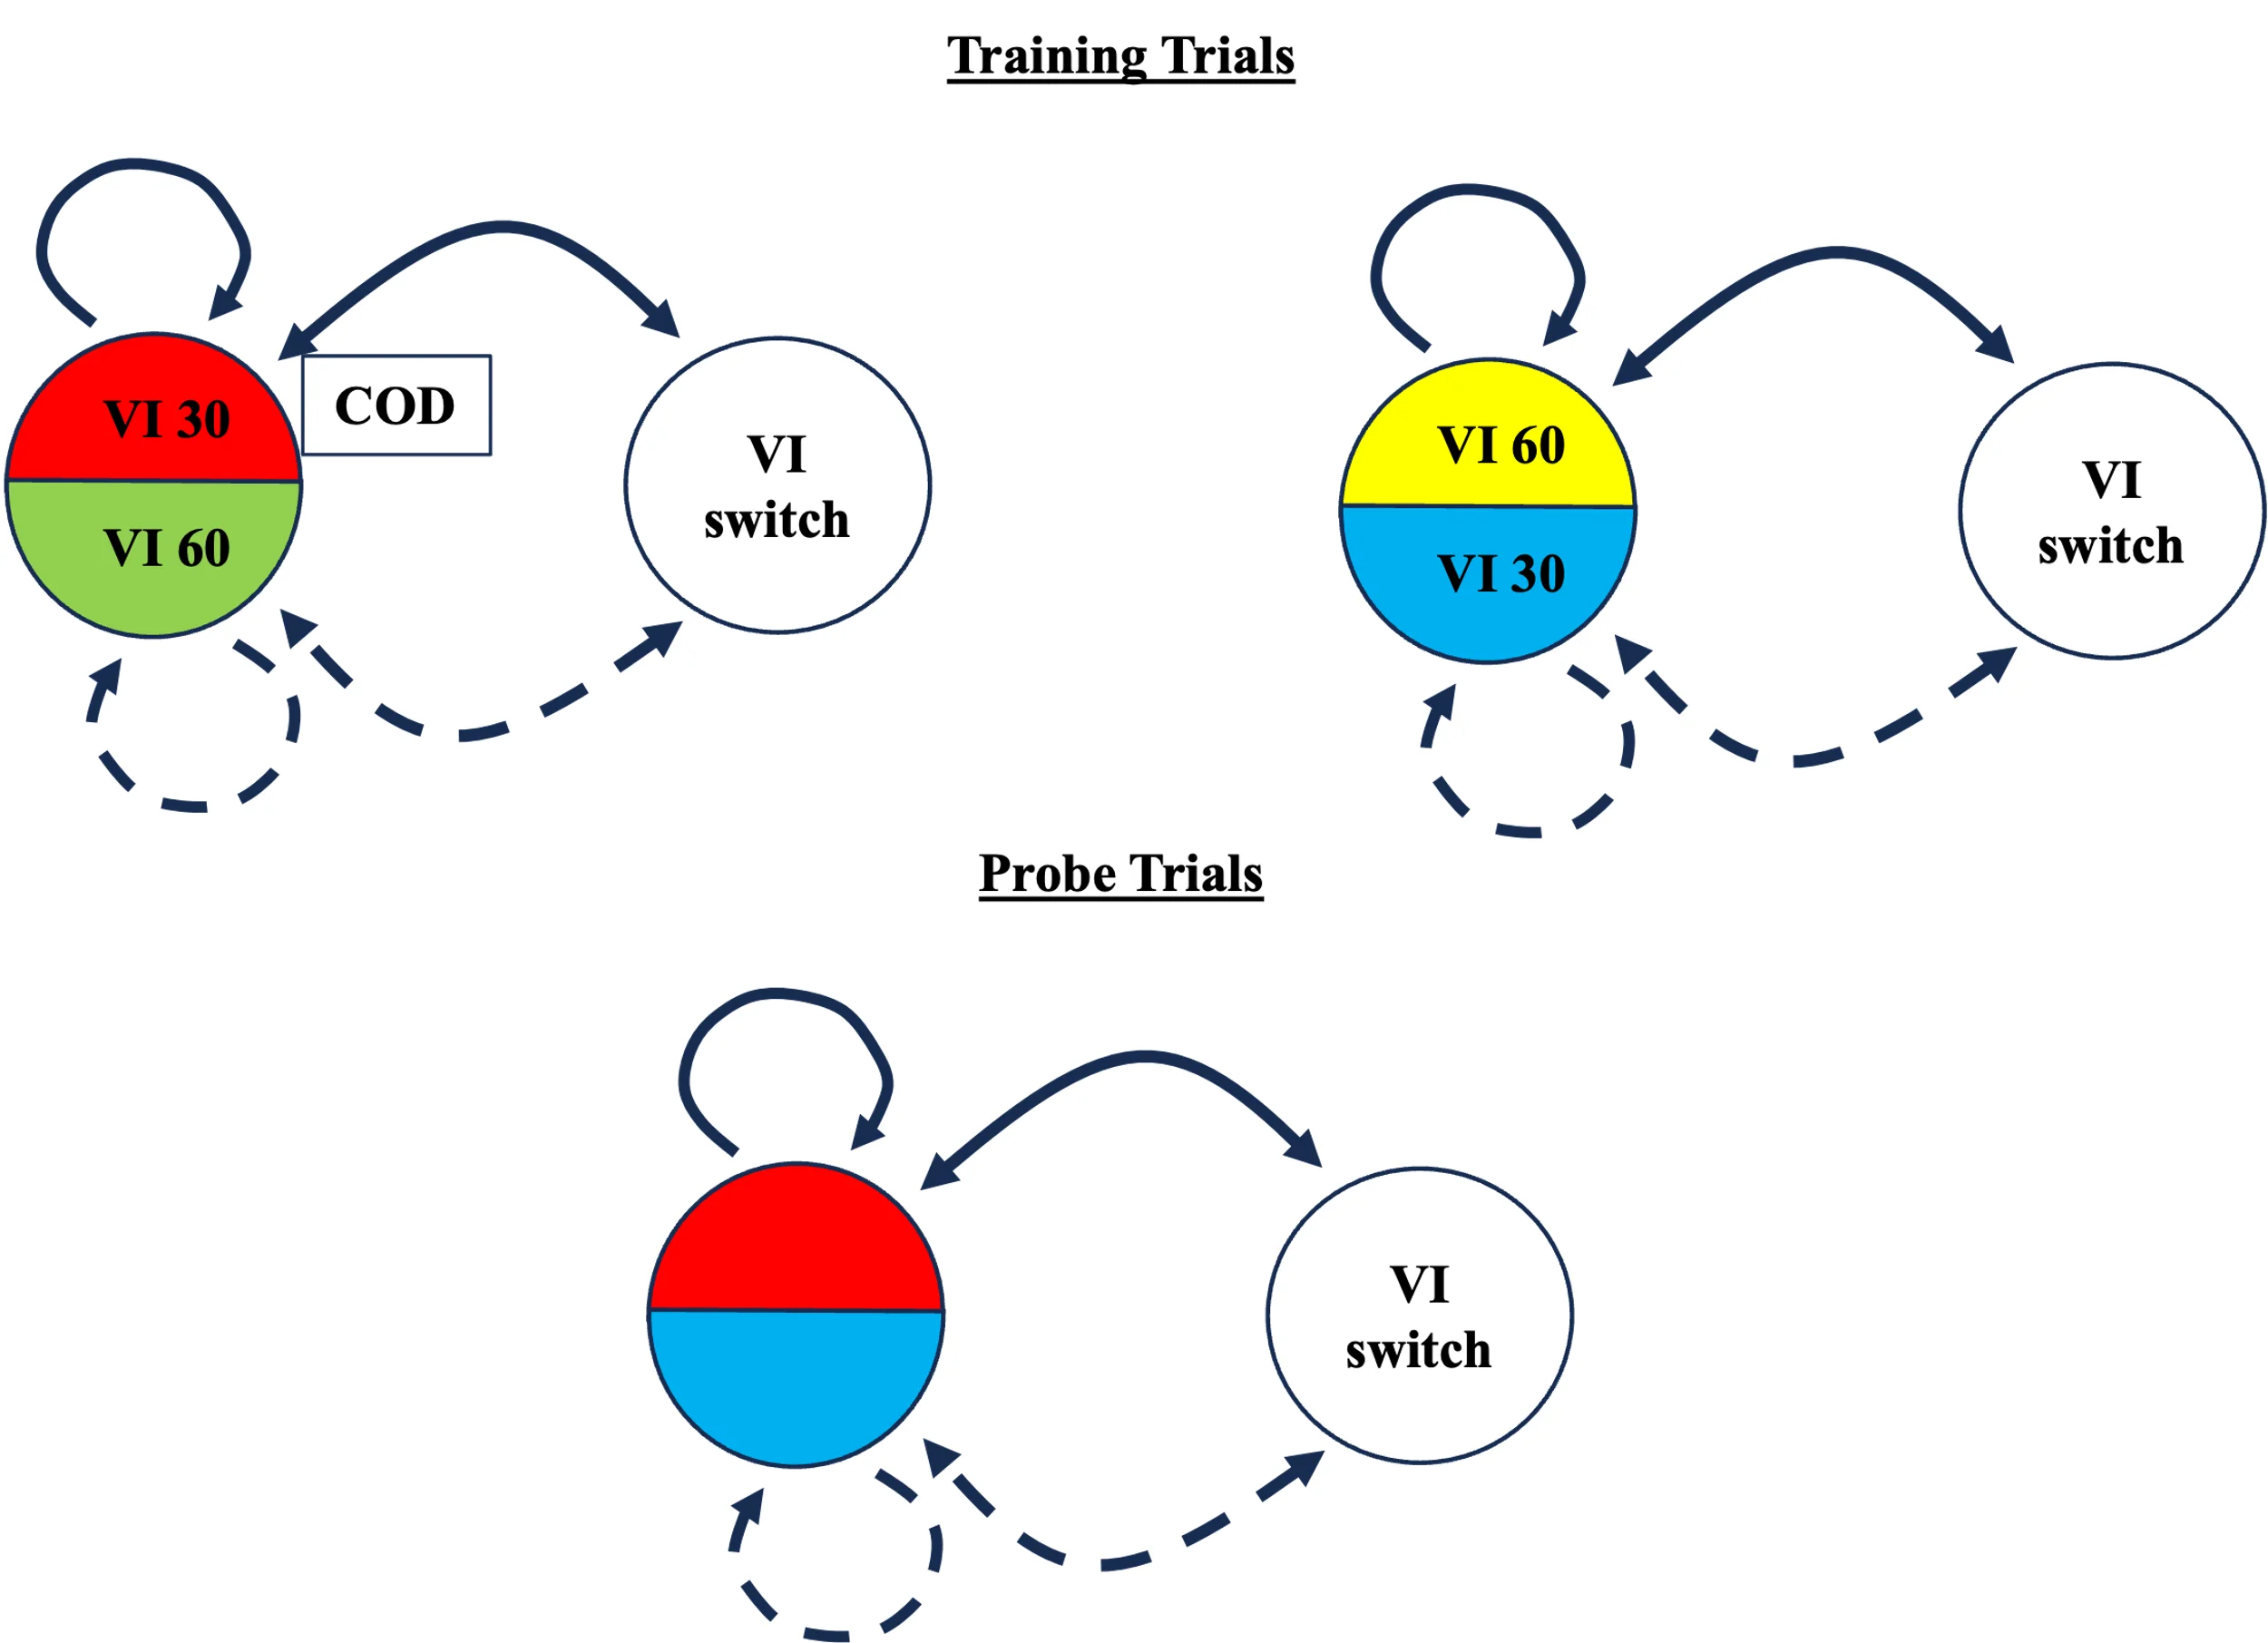
To test our hypothesis, pigeons were trained using a multiple concurrent VI VI schedule design as illustrated in Figure 2. The concurrent VI VI schedules were identical VI 30-s VI 60-s schedules. However, in one schedule pair, the VI 30-s schedule, and only the VI 30-s schedule, employed a 2.5-s changeover delay. We further utilized a modified 3-key Findley procedure (Findley, 1958) in which pecks to either of two side switch keys controlled the operative VI at the center schedule key.

The rationale for our experimental design was focused on providing as much discrimination as possible for switch and stay responses made to the different VI schedules. In contrast with a normal 2-key Findley procedure, the discriminative stimulus for switching into any given VI schedule would be unique. Side-peck green would control switches into VI-green; side-peck red would control switches into VI-red, and so forth. Secondly, by assigning a COD to only a single VI schedule, we hoped to test several hypotheses. In our case, we predicted that the COD would result in more extreme preference when preference was measured in terms of discrete pecks. The reason for this prediction is that, if a switch into the VI 30COD schedule becomes organized as a switch bout, then multiple schedule-key pecks may function as components of a single switch unit. A peck-based measure would therefore count each component response separately, producing an apparent increase in preference for the COD-associated schedule even if allocation measured in response units or dwell time did not increase. Other hypotheses have suggested that a COD is a cost added to a switch into a VI schedule (e.g., Gomes-Ng et al., 2018; Shahan & Lattal, 1998, 2000). Such a hypothesis would actually predict a result that would be the opposite of our own prediction – namely, that the implementation of a COD would result in less extreme preference for a VI schedule paired with a COD.

Our selection of a 2.5-s COD was also made intentionally. In the pigeon literature, a COD of 2 s is commonly used in concurrent VI VI experiments. However, most of these studies do not utilize a switch key. That is, the COD is triggered with the first peck to a schedule key. In our experiment, and indeed in any experiment utilizing a Findley procedure, switches into a VI schedule require a peck to a switch key, followed by a peck to the schedule key. To account for this time lag, we assumed a “switch time” of approximately 0.5 s (e.g., see IRT distributions in Brown & Cleaveland, 2009; McKenzie & Cleaveland, 2010).

Finally, our experimental design also conducted probe tests using a common procedure in which the stimuli associated with the two VI 30-s schedules are briefly paired under non-reinforcement. McDevitt and Bell (2013) found that preferences obtained during such probes were predicted by the dwell times obtained during VI VI training. Williams and Bell (1999), however, observed that the reinforcement rates associated with a stimulus during training predicted probe preference, not associated dwell times. Our own prediction is that, if there is evidence of switch bouts during VI VI training, then preference during novel probe tests will favor the stimulus associated with switch bouts, all else being equal.

Figure 2
Experiment 1 Design

A diagram showing experimental schedule arrangements for pigeons under concurrent VI VI reinforcement. The top "Training Trials" section depicts two schedule pairs using colored circles: red/green (VI 30/VI 60) with a COD box, and yellow/blue (VI 60/VI 30). The bottom "Probe Trials" section pairs red and blue VI 30 stimuli. Solid and dashed arrows indicate stay and switch response transitions between changeover states.

Method

Subjects

All animal care and the procedures described below were approved by Vassar College’s Institutional Animal Care and Use Committee (IACUC). Eight adult pigeons (White Racing Homing, WhitePigeonSales.com) were used for this experiment. One subject was subsequently dropped from the experiment due to consistent cessation of responding during training. This left us with seven effective subjects. All birds were maintained within a band of 85%–90% of their free-feeding weights. If food obtained during an experimental session was not sufficient to maintain the target weight, mixed grain was provided after a minimum of 1 hr post-session. Birds received mixed grain (Daily 14% POP, Puregrain.com) during the time period of the experiment. When in their home cages, all birds had ad libitum access to water and grit. Multivitamins (New England Pigeon) were added to the birds’ water on weekends. Subjects were housed individually under a 12:12-hr light/dark cycle in stainless steel cages (35 cm × 40 cm × 45 cm).

Apparatus

Two Med Associates operant chambers (32 cm × 35 cm × 29 cm; ENV-007) were utilized. Each was placed inside a sound- and light-attenuating box (64 cm × 43 cm × 56 cm; ENV-018V). The mounted fan provided ventilation and white noise for the duration of each session. Each operant chamber was connected to a computer running MED-PC IV. Three response keys (ENV-126AM), placed 6 cm apart, were mounted 22 cm from the floor. A 28-V, 100-mA light, 2 cm below the ceiling, provided light for the bird during experimental sessions. An opening, located 3 cm from the floor beneath the center key, provided access to a grain hopper (ENV-205M) when activated.

Procedure

Pre-training

All birds first underwent pre-training. This consisted of sessions defined by autoshaping, alternation training, and experience with “long” blocks of the two experimental, concurrent variable-interval (VI) VI schedules.

Autoshaping sessions consisted of trials that paired a stimulus with a subsequent food presentation. At the start of a trial, the center “schedule key” was illuminated with a randomly selected color (red, blue, yellow, or green). After 20 s, or until a single peck (FR 1) to the illuminated schedule key, the stimulus was turned off and the food hopper was immediately raised for 10 s. Trials were separated by a 30-s intertrial interval (ITI), during which pecks to the schedule key had no effect. Throughout a session, the house light and fan were turned on. Autoshaping sessions lasted for a maximum of 60 min or until 30 reinforcements had been delivered, whichever occurred first. After five sessions, all birds were collecting 30 reinforcements per session and were moved on to alternation training.

Alternation Training

The first set of alternation training consisted of three sessions. During these sessions, a “switch key” (side key) was illuminated with a color – either red/green or blue/yellow. A peck to the illuminated switch key turned off the switch key stimulus and caused the same color to illuminate the center schedule key. A single peck (FR 1) to the schedule key then turned off the key and raised the hopper for 4 s. After reinforcement, the alternate switch key was illuminated (either red/green or blue/yellow). Each session consisted of 10 blocks of six reinforcements. Within a block, only a single stimulus pairing was active (e.g., red/green or blue/yellow). Blocks were separated by a 15-s period in which the house light and key lights were turned off. At the start of a block, the house light was re-illuminated, a switch key was randomly selected, and it was illuminated with the appropriate color stimulus.

After three sessions of simple alternation training, the birds experienced five sessions of “concurrent” alternation training in which the FR requirement at the schedule key was increased across sessions. During concurrent alternation training, both switch keys and the schedule key were simultaneously illuminated. Pecks to an illuminated switch key changed the color of the schedule key to match that of the just-pecked switch key. Pecks at the schedule key were reinforced according to an FR schedule and an alternation contingency. For example, a response at a green schedule key would be reinforced if red was the most recently reinforced color, but not if green was the most recently reinforced color. Each session consisted of 10 blocks of six reinforcements (4-s access to the food hopper). Within a block, only a single pairing of stimuli was active (red/green or blue/yellow), and the first to-be-reinforced stimulus of a block was determined randomly within the pair. Between blocks, all stimuli and the house light were turned off for 15 s. Across sessions, the FR values were FR 1 for Session 1, FR 2 for Session 2, and FR 5 for Sessions 3 through 5.

Training

After completing alternation pre-training, birds were switched to a multiple-component VI 30-s VI 60-s, VI 30-s VI 60-s schedule. Pecks to the center schedule key were reinforced according to the active schedule, while pecks to either of the illuminated switch keys changed the stimulus at the schedule key, along with the associated VI schedule. Reinforcements consisted of 4-s access to the grain hopper and were programmed according to an exponential distribution as given by

\(\begin{equation*}p(rnf) = 1 – e^{-\lambda t}\end{equation*}\)

where p(rnf) is the probability of reinforcement after a peck to the schedule key, λ is the average rate of reinforcement given by the active VI schedule, and t is the interresponse time (IRT) as defined by the time elapsed since the most recent response to that schedule. During reinforcement deliveries, IRT clocks – t in the above equation – were paused.

The only difference between the two VI 60-s VI 30-s concurrent schedules, aside from stimulus assignments, was that a 2.5-s changeover delay (COD) was attached to one of the VI 30-s schedules (VI 30COD). The COD was triggered by a peck to the relevant switch key (i.e., the switch key illuminated with the color associated with the VI 30COD schedule). During the COD, IRTs accumulated normally across all VI schedules, but any programmed reinforcement delivery to the VI 30COD was held until the first post-COD schedule key peck.

The first three sessions of multiple concurrent schedule training consisted of 12 3-min blocks of each schedule pairing. Subsequent training sessions then consisted of 24 90-s blocks of each concurrent schedule. Blocks were sequenced quasi-randomly such that no more than three blocks of a single stimulus pairing would occur in a row. Between blocks, all keys and the house light were turned off for 15 s. Each bird was run under their training regimen at least 5 days per week for a total of 30 sessions. The baseline criterion of 30 sessions was selected based on both personal experience and the cited literature. In the author’s laboratory, birds tend to reach baseline stability in concurrent VI VI paradigms (in terms of preference) after about 15–20 sessions. Therefore, 30 sessions of training were largely selected as a matter of convenience, as well as to align the method with that reported in the cited literature. After this training, each bird experienced two probe sessions, followed by 10 additional training sessions, and a final two probe sessions.

Vi 30cod – Vi 30 Probes

During probe sessions, the normal VI 30-s VI 60-s and VI 30COD VI 60-s blocks were mixed with unreinforced probe blocks that paired the two VI 30-s discriminative stimuli. For example, a bird trained with yellow (VI 30) and green (VI 30COD) stimuli experienced unreinforced probe trials in which the two switch keys were illuminated yellow and green. Pecking either of these keys illuminated the center schedule key with the pecked color as normal. However, pecks to the schedule key did not produce reinforcement for the duration of the probe block. Probe blocks were 90 s each, and a total of four were intermixed per probe session. The occurrence of probe trials was bounded such that they could not occur during the first four blocks of a session. After the fourth block, they were randomly allotted every 4 – 6 blocks. By the end of the experiment, each bird had experienced 16 total VI 30 VI 30COD probe trials of 90 s each.

Results

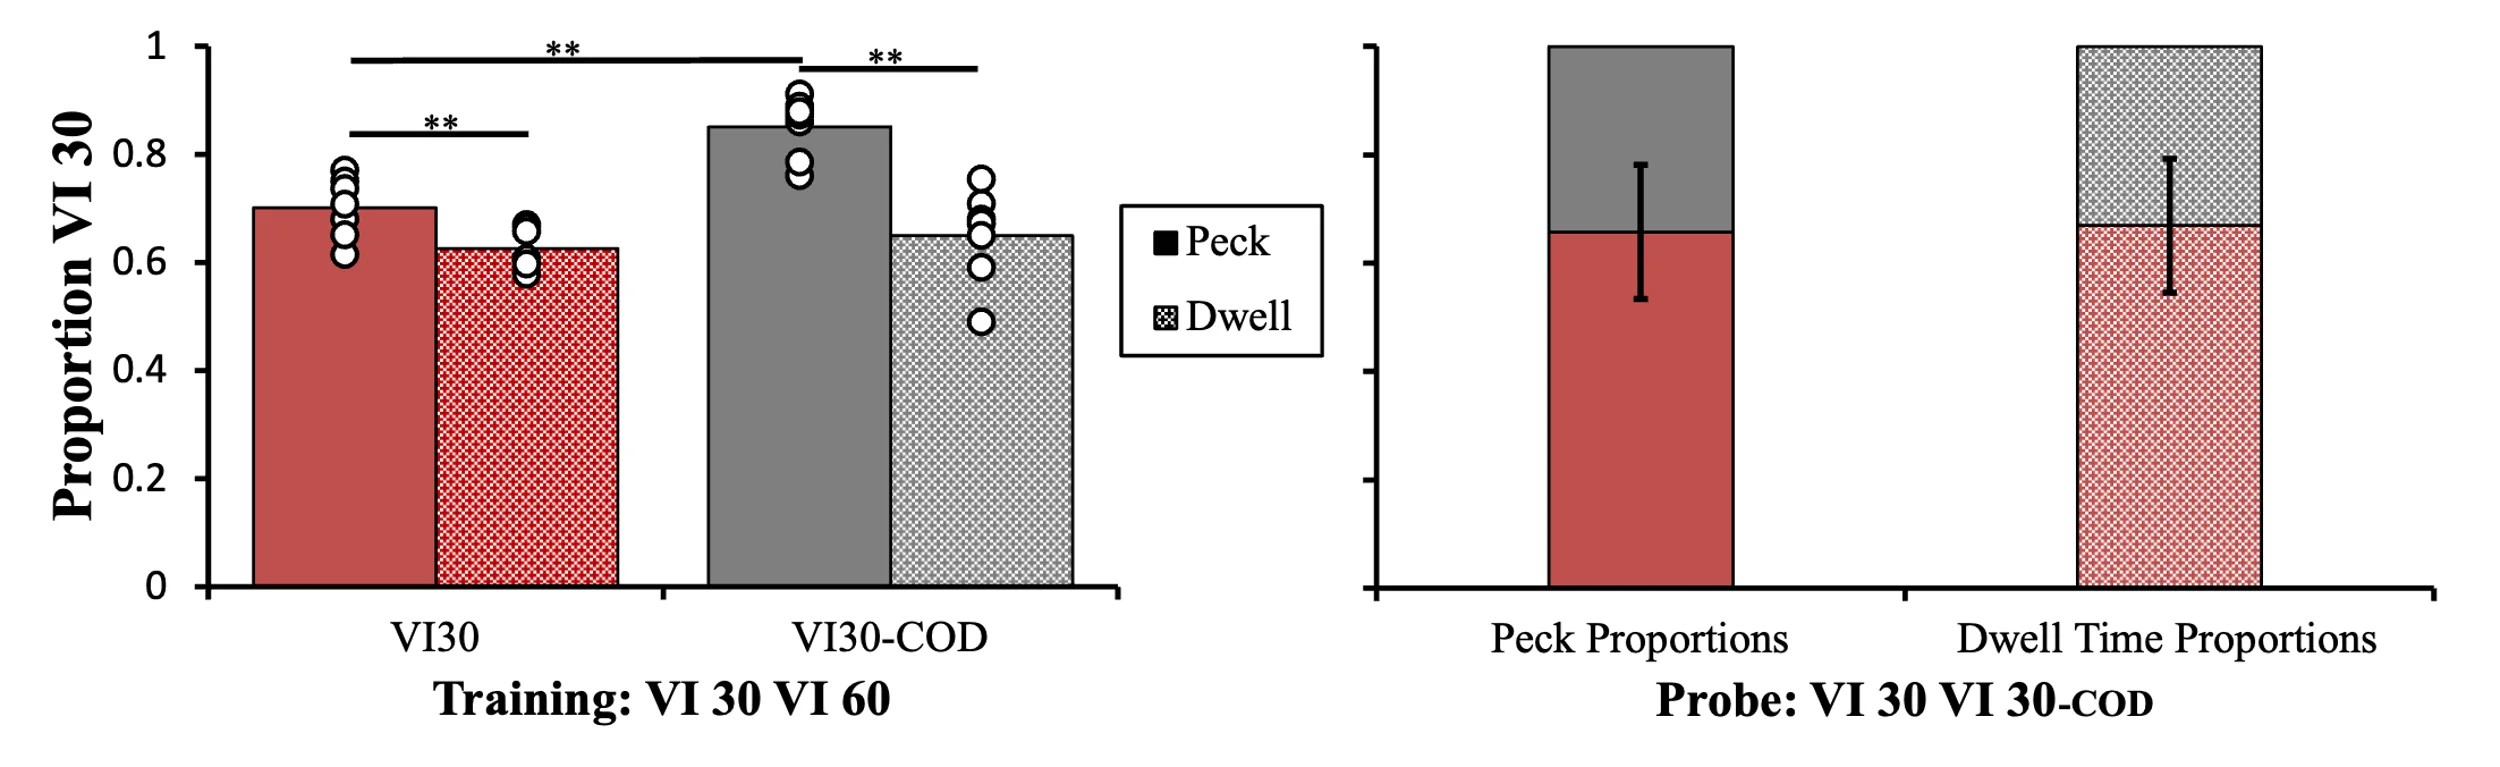
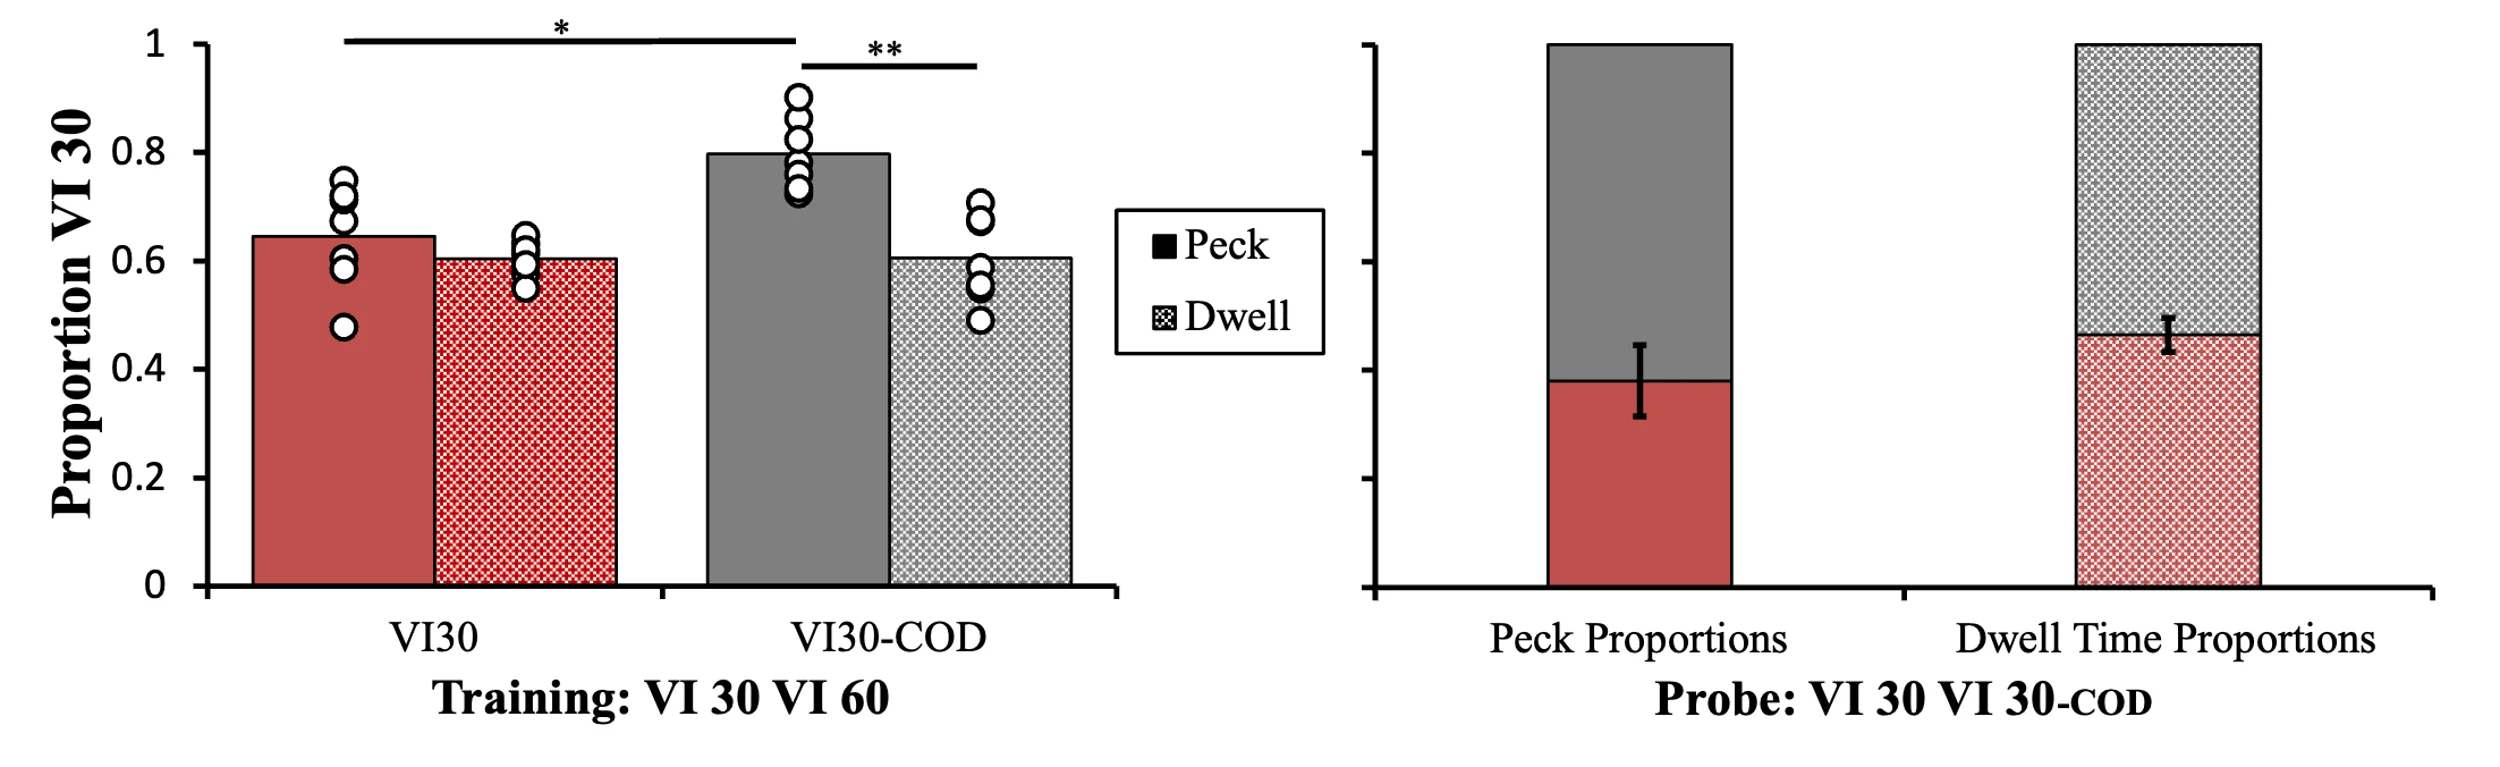
In Experiment 1 the final five sessions of training provided an average of 9224.7 responses per subject for analysis. All subjects showed a preference for the VI 30-s and VI 30COD schedules. However, the preference was more extreme for the VI 30COD schedule. Figure 3 provides the proportion of schedule-key pecks made at both the VI 30 and VI 30COD stimuli during the final five VI 30 VI 60-s and VI 30COD VI 60-s training sessions that preceded the first set of probe sessions. Proportions were calculated both in terms of schedule responses (i.e., not inclusive of the first switch response to a schedule) and dwell times. Dwell times consisted of the total duration that a schedule key was active.

Birds showed significantly more preference for the VI 30COD schedule when preference was calculated in terms of schedule responses, MVI30cod = .85, SE = .02; MVI30 = .70, SE = .02; t(6) = 3.98, p < .001. When preference was calculated in terms of relative dwell times, no significant difference was observed between the two VI 30-s schedules, MVI30cod = .65, SE = .02; MVI30 = .63, SE = .02; t(6) = .55, p = .59. Despite a relative peck-based stimulus preference of VI 30COD > VI 30 during training, probes generated the opposite result. Birds showed roughly a 2:1 preference for the VI 30 stimulus whether calculated in terms of schedule responses or dwell times, Mresp = 0.65, SE = 0.05; Mdwell = 0.67, SE = 0.05.

Figure 3
Preference During Training and Probe Trials (Expt. 1)

A dual bar chart showing pigeon response preferences during concurrent VI schedules. The left panel plots Proportion VI 30 (y-axis, 0 to 1) for VI30 and VI30-COD conditions during training, comparing Peck (solid) and Dwell (dotted) bars with individual data points and significance markers (**). The right panel shows stacked Peck Proportions and Dwell Time Proportions during probe trials (VI 30 VI 30-COD) with error bars, indicating stronger preference under the COD condition.
Note. Baseline relative responding to the VI 30-s schedules with (red) and without COD (grey). Relative peck-based proportions are given by solid shading. Relative dwell-based proportions are given by the hatched shading. Baseline proportions were calculated over the last five training sessions. Probe proportions were calculated during the four probe sessions in which the stimuli associated with the VI 30COD and VI 30 schedules were paired. Open circles indicate obtained proportions of the individual birds.

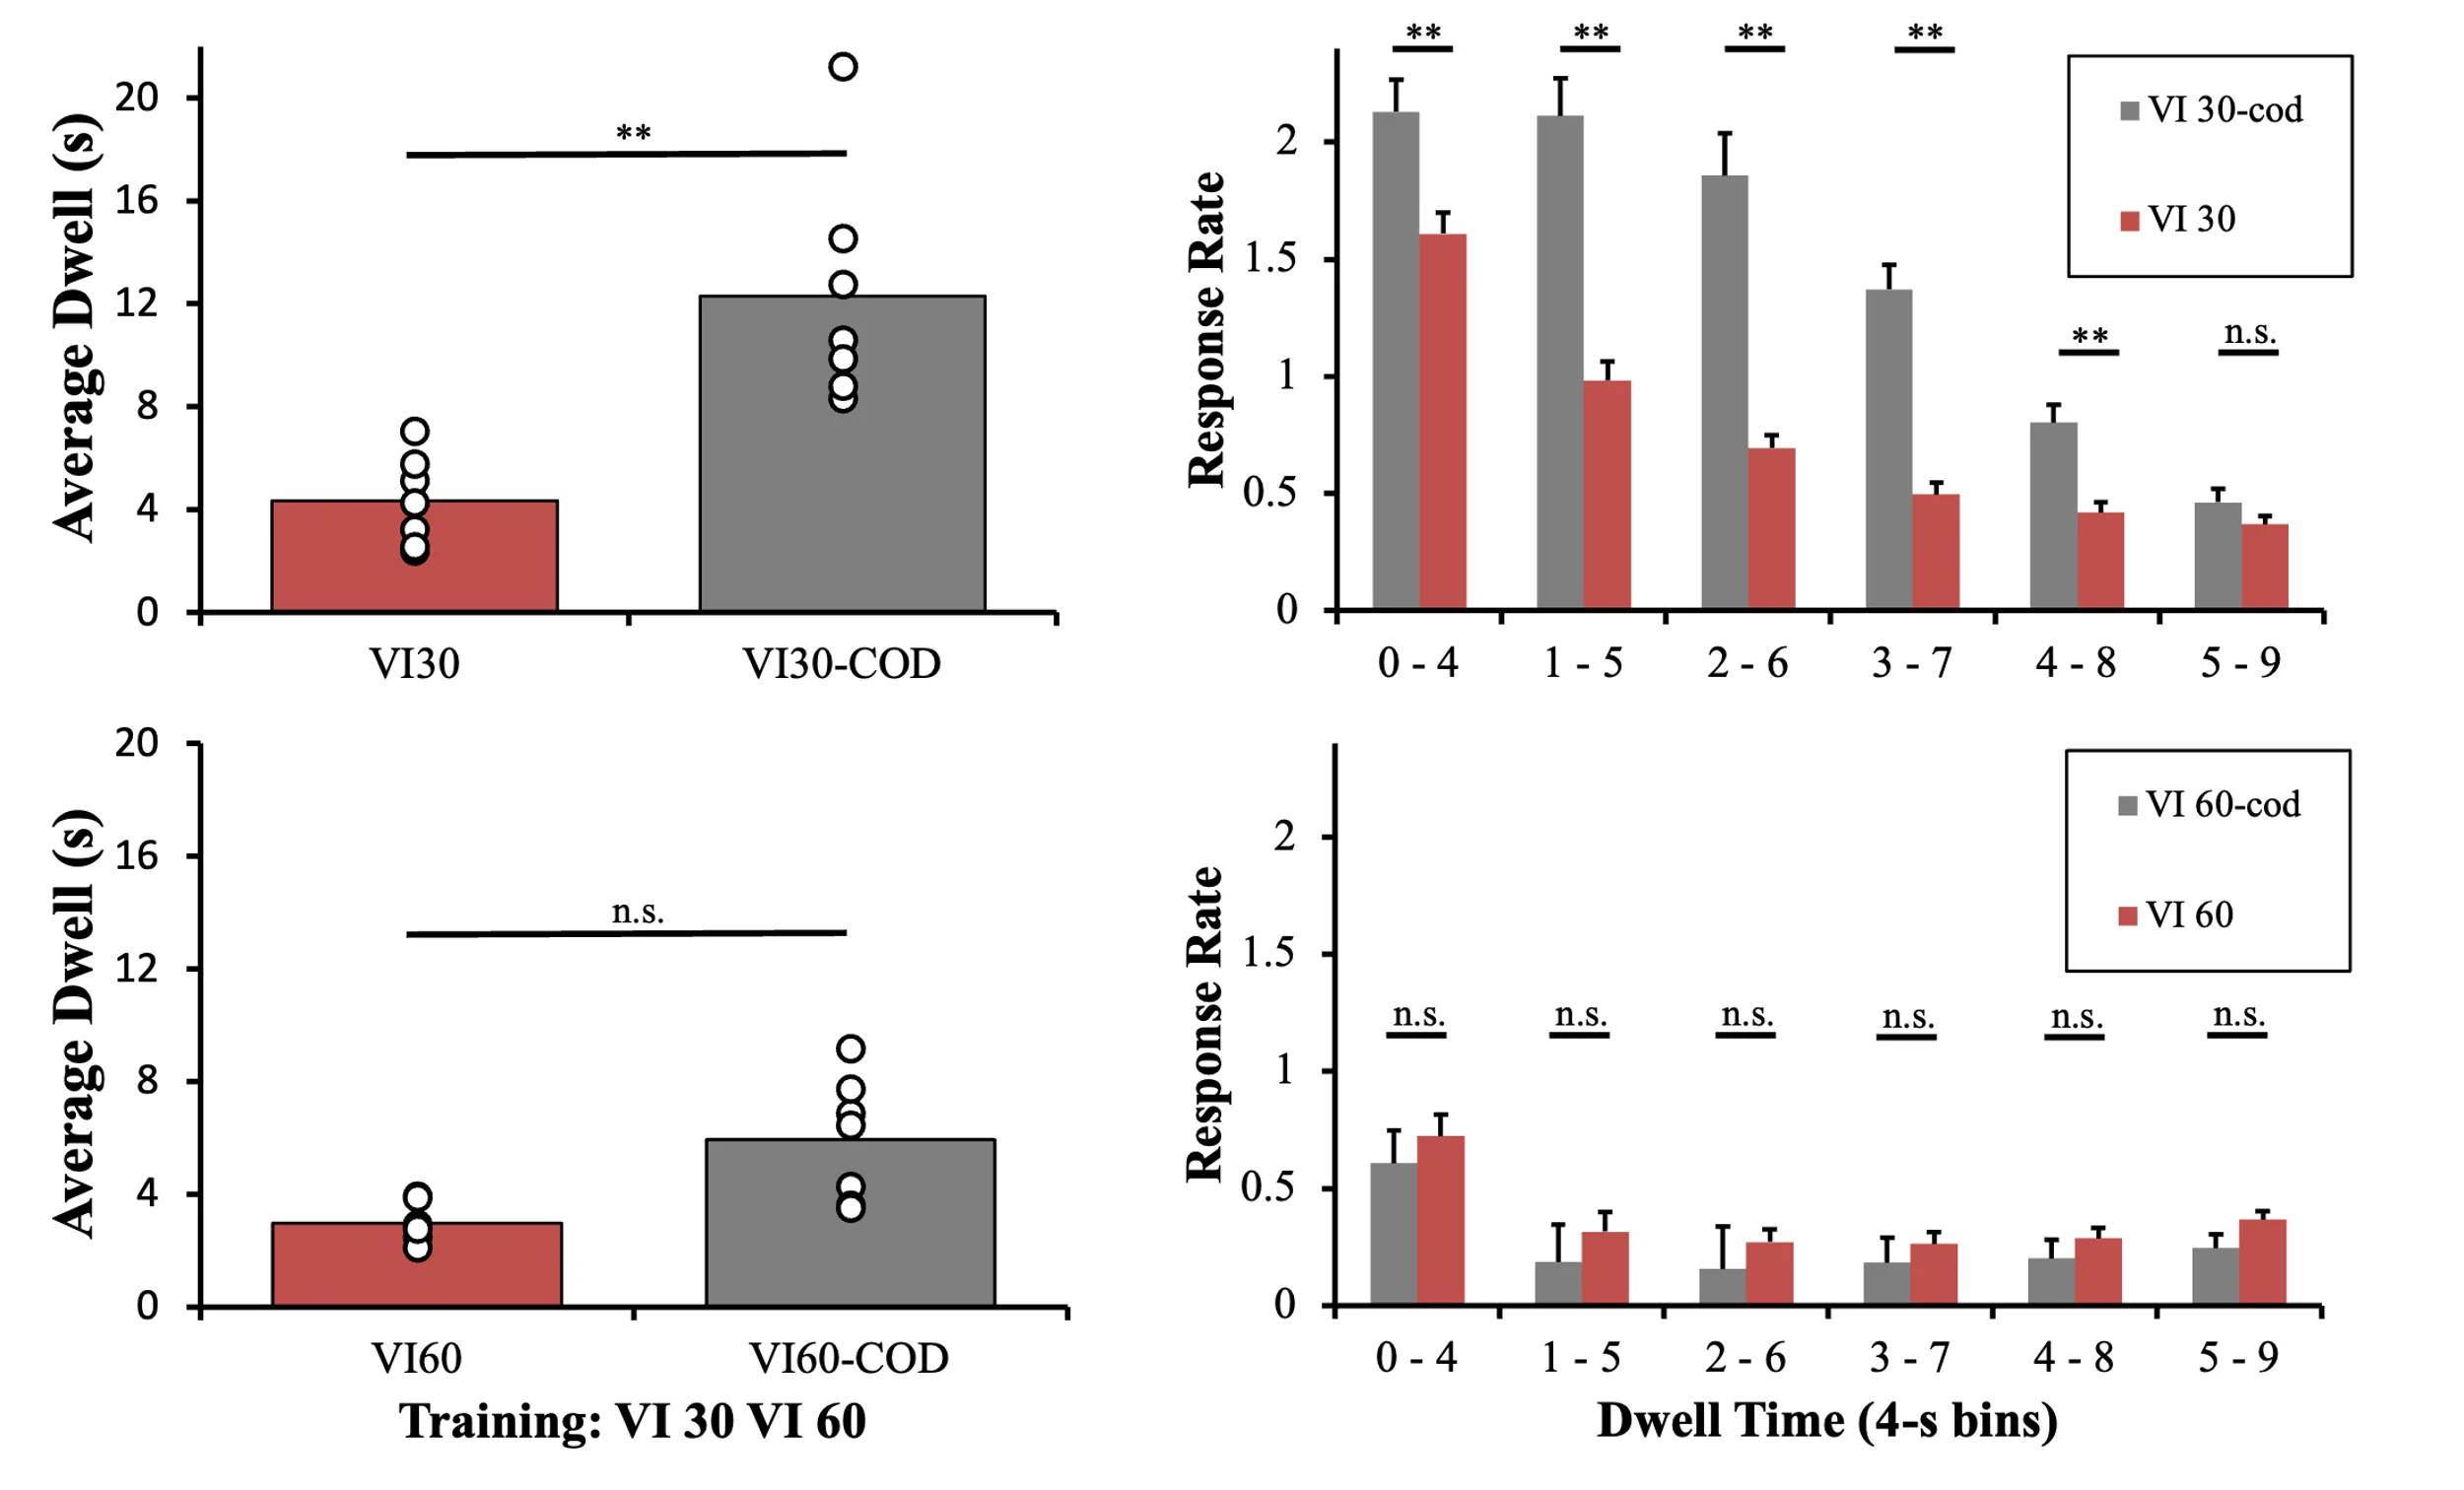
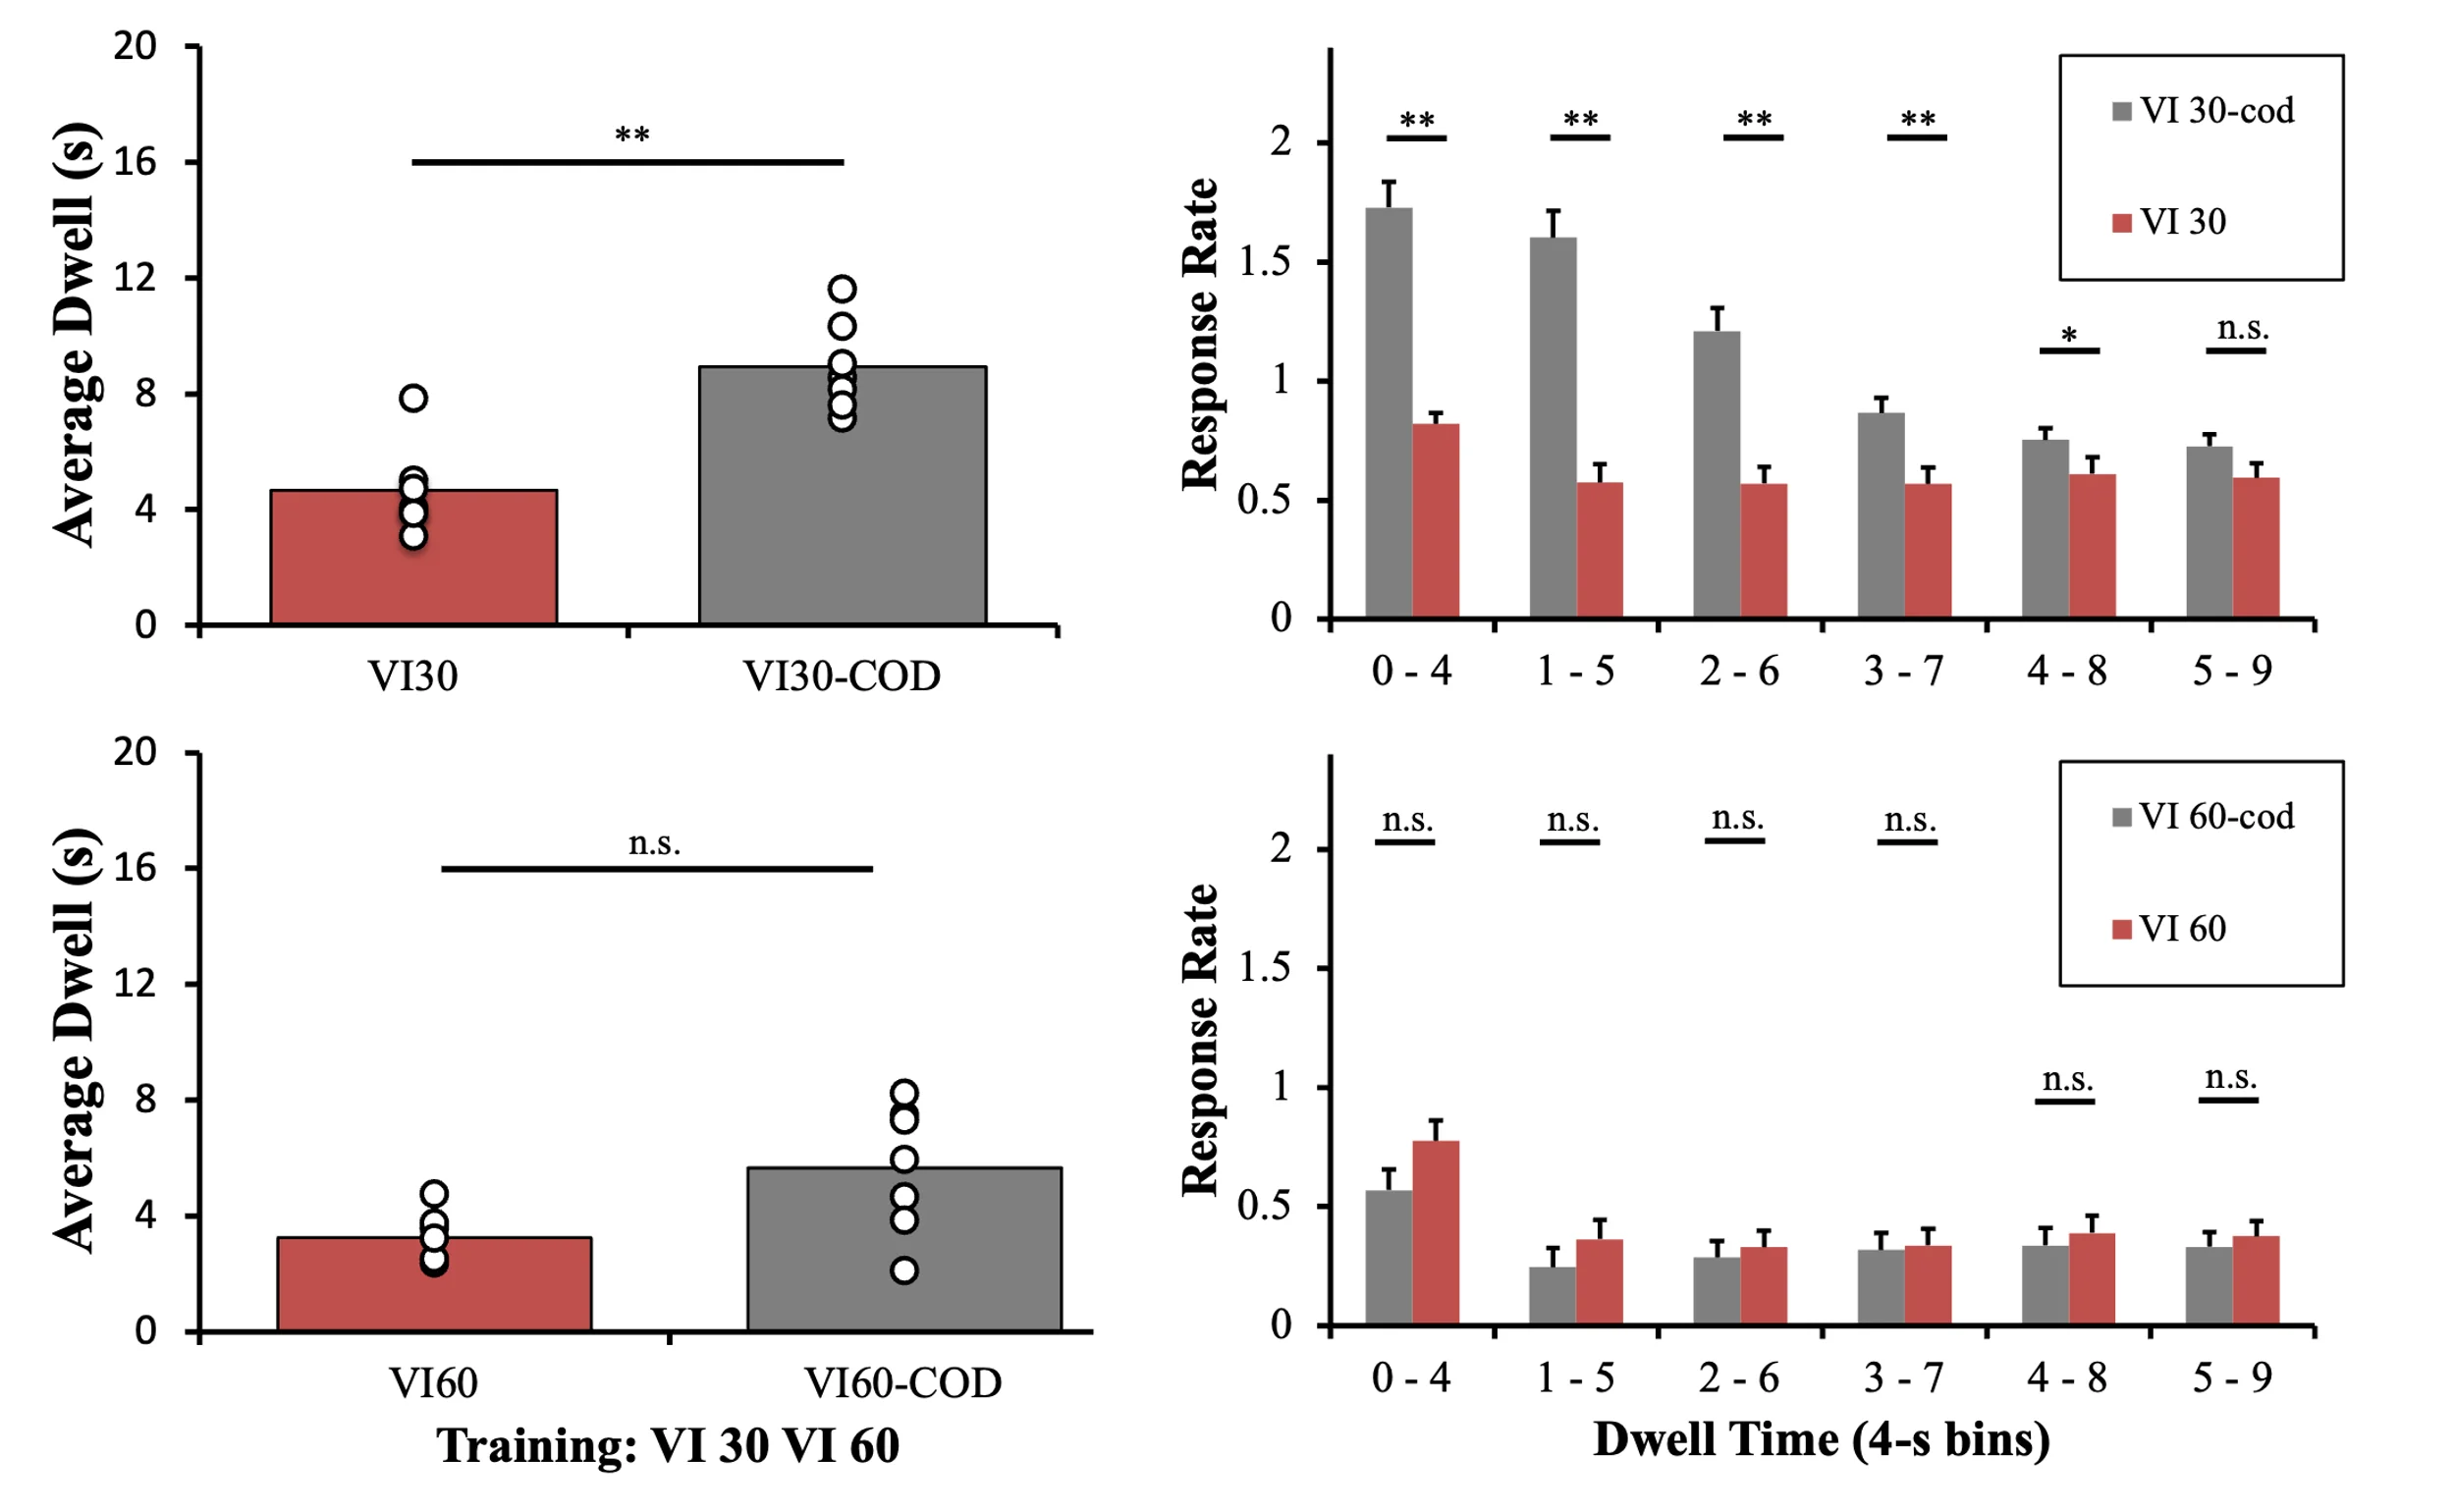
Figure 4 provides an analysis of COD effects on molecular response structure during training. All analyses were drawn from the final five training sessions that preceded the first set of probe sessions. First, Figure 4A provides the average dwell times observed in the two VI 30-s schedules and their paired VI 60-s schedules. The VI 30COD VI 60-s schedule pairing produced dwell times that were significantly greater than those observed in the VI 30 VI 60-s pairing (MVI30cod = 12.3 s, SE = 1.71; MVI30 = 4.3 s, SE = .65, t(6) = 3.96, p < .001; MVI60cod = 4.33, SE = .83; MVI60 = 2.98 s, SE = .25, t(6) = 3.06, p = .02). In terms of actual rates of responding, Figure 4 provides a 4-s moving average for the first 9 s that a bird spent responding to the schedule key. At both the VI 30COD and the VI 30-s schedules, birds showed a relatively high rate of responding that decreased with time spent at the schedule. However, responding to the VI 30COD schedule was made at a significantly higher rate, MANOVA Pillai’s Trace, F(6, 7) = 13.42, p = .0016. This difference remained significant until the last time bin, univariate ANOVA F(1, 12) = 1.92, p = .18. Conversely, no difference in response rates was observed between responses made to the two VI 60-s schedules, MANOVA Pillai’s Trace, F(6, 7) = 1. 63, p = .27.

Figure 4
Average Dwell Times and Response Rates (Expt. 1)

A four-panel bar chart showing pigeon training data comparing schedules with and without changeover delays (CODs). Left panels plot Average Dwell (s) with individual data points: VI30-COD shows significantly longer dwell than VI30 (**), while VI60-COD versus VI60 is non-significant. Right panels plot Response Rate across Dwell Time (4-s bins, 0-4 through 5-9), showing significantly higher rates for VI30-COD than VI30 in early bins, but no differences for VI60 conditions.

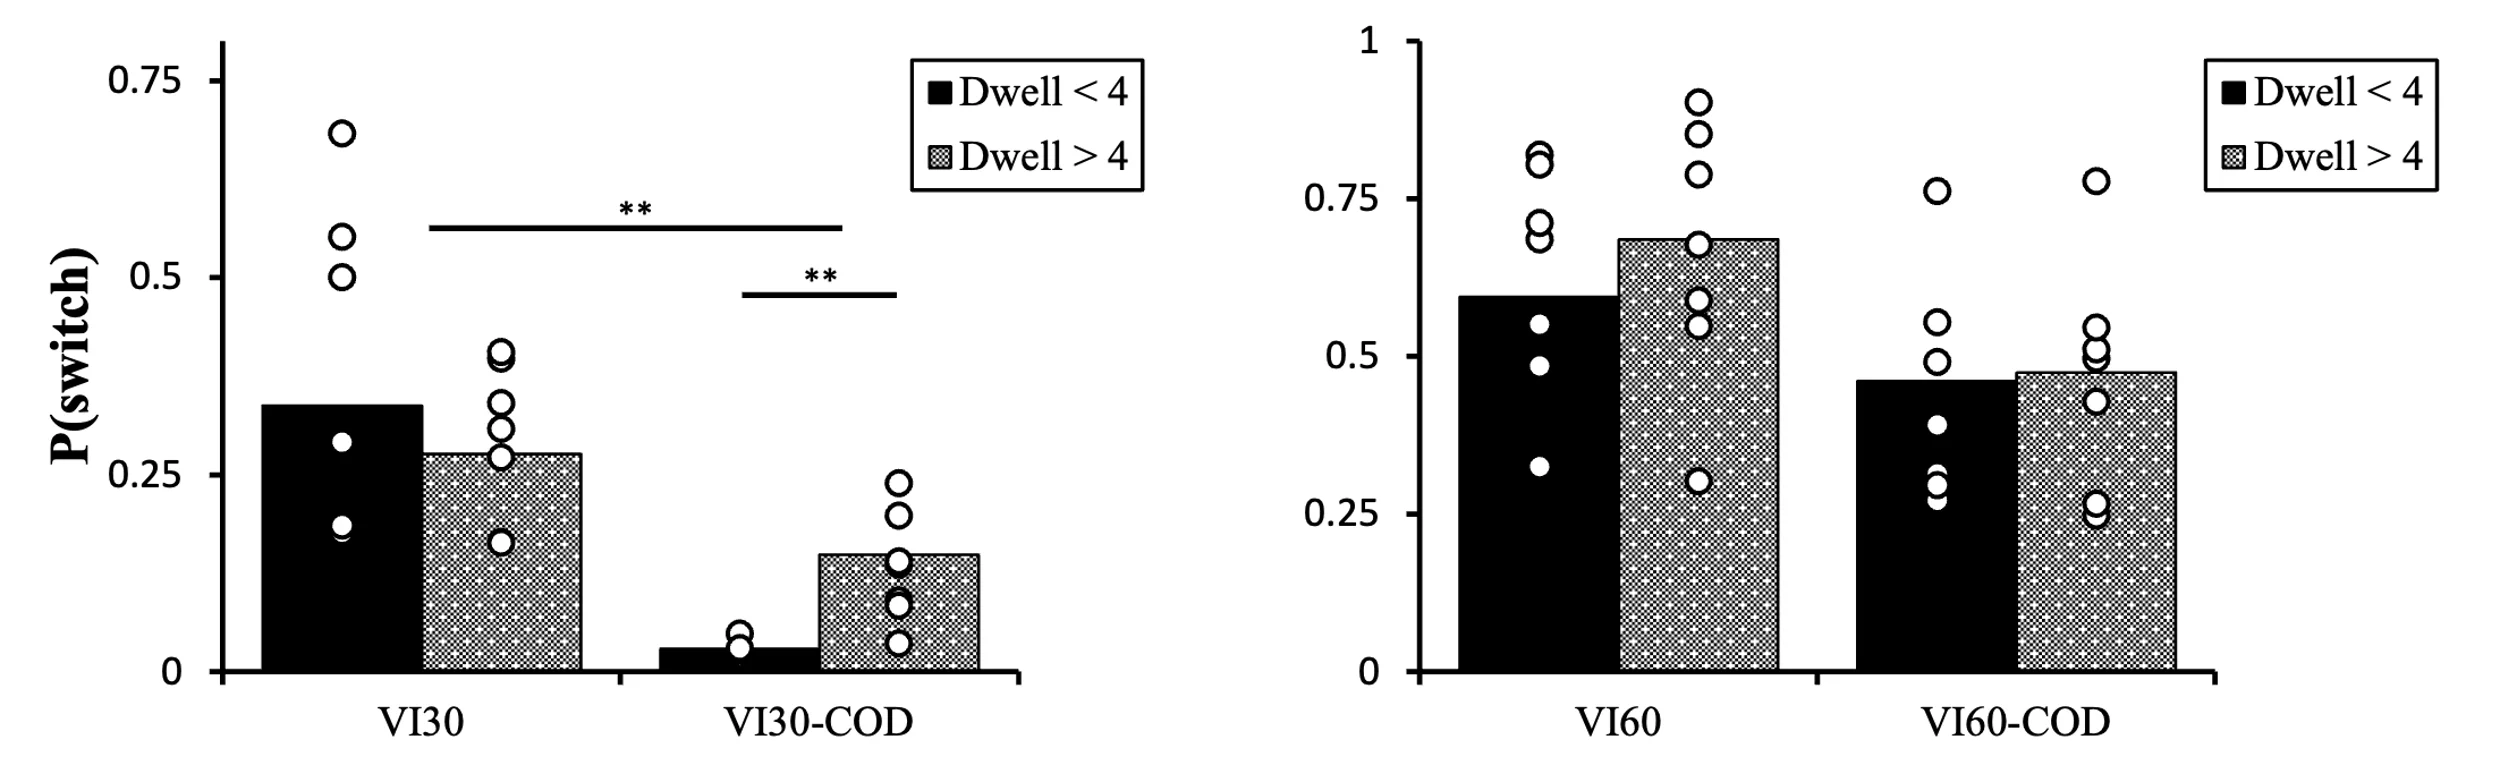
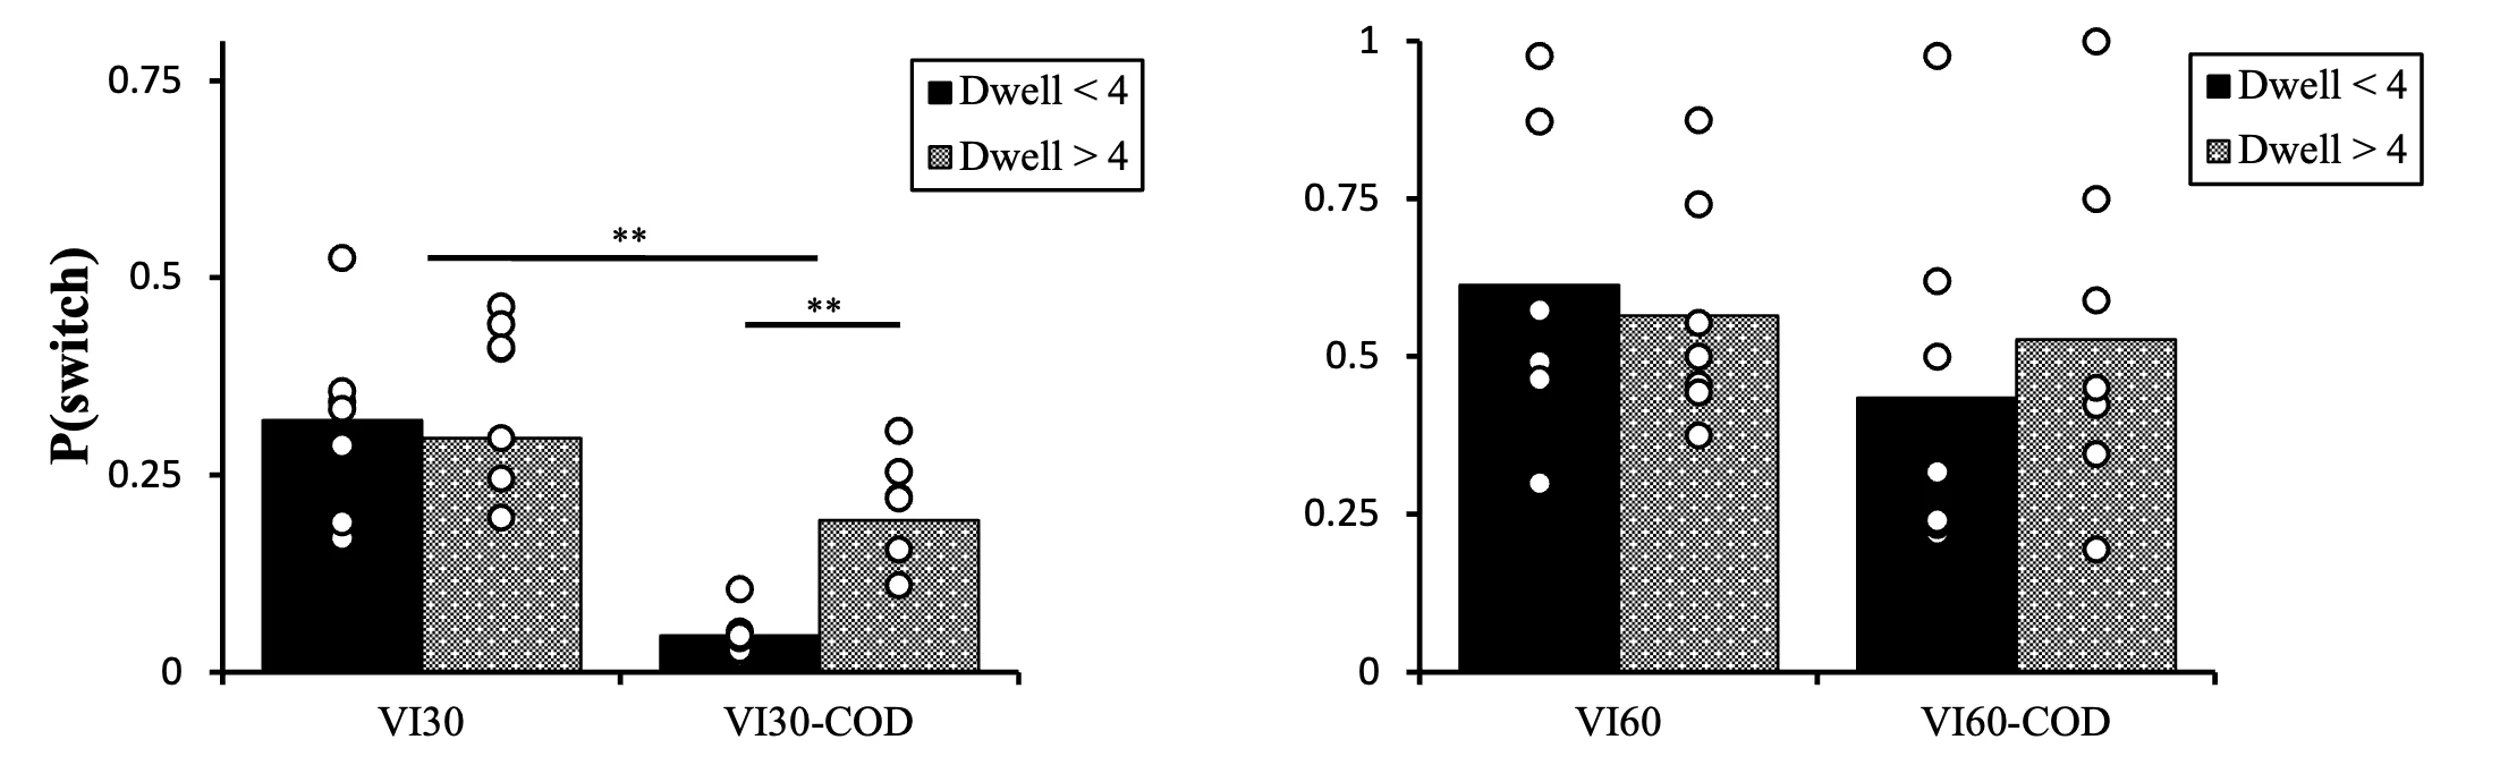
Figure 5 provides another measure of molecular choice structure, namely the probability of switching out of a given schedule. Given the evidence provided by Figure 4 that early responding at a schedule is different than that observed later in the schedule (at least at the VI 30-s schedules), we separated the analysis by dwell time. Figure 5 provides the probability of a switch out of a schedule during the first 4 s of dwell time versus dwell times greater than 4 s. Birds were overall significantly less likely to switch out of the VI 30COD schedule when compared with the VI 30-s schedule, MANOVA Pillai’s Trace, F(2, 11) = 8.69, p = .005. Relatedly, when responding to the VI 30COD schedule, birds were significantly less likely to switch during the first 4 s of responding in comparison to longer dwell times, t(6) = -4.09, p = .0065. In contrast, when responding to the VI 30-s schedule, there was no significant difference in the probability of switching out of the schedule at short versus longer dwell times, t(6) = 1.58, p = .166.

Figure 5
Dwell Times and Switch Probabilities (Expt. 1)

A pair of bar charts showing P(switch) on the y-axis (0 to 0.75 left, 0 to 1 right) for pigeons across schedule conditions. The left panel compares VI30 and VI30-COD, and the right compares VI60 and VI60-COD, each split by Dwell<4 (black) and Dwell>4 (gray) bars with overlaid individual data points. Switch probability drops sharply for short dwells under VI30-COD, marked by significant (**) comparisons.
Note. The figure shows the probability of a switch from each reinforcement schedule at short (black bars, less than 4 s) and long dwell times (grey bars, greater than 4 s). Note that the VI 60-COD indicates the VI 60-s schedule paired with the VI 30COD schedule. Only the single VI 30COD schedule had a programmed COD attached to it. Only significant differences are indicated in the figure. Open circles are the obtained probabilities of the individual birds.

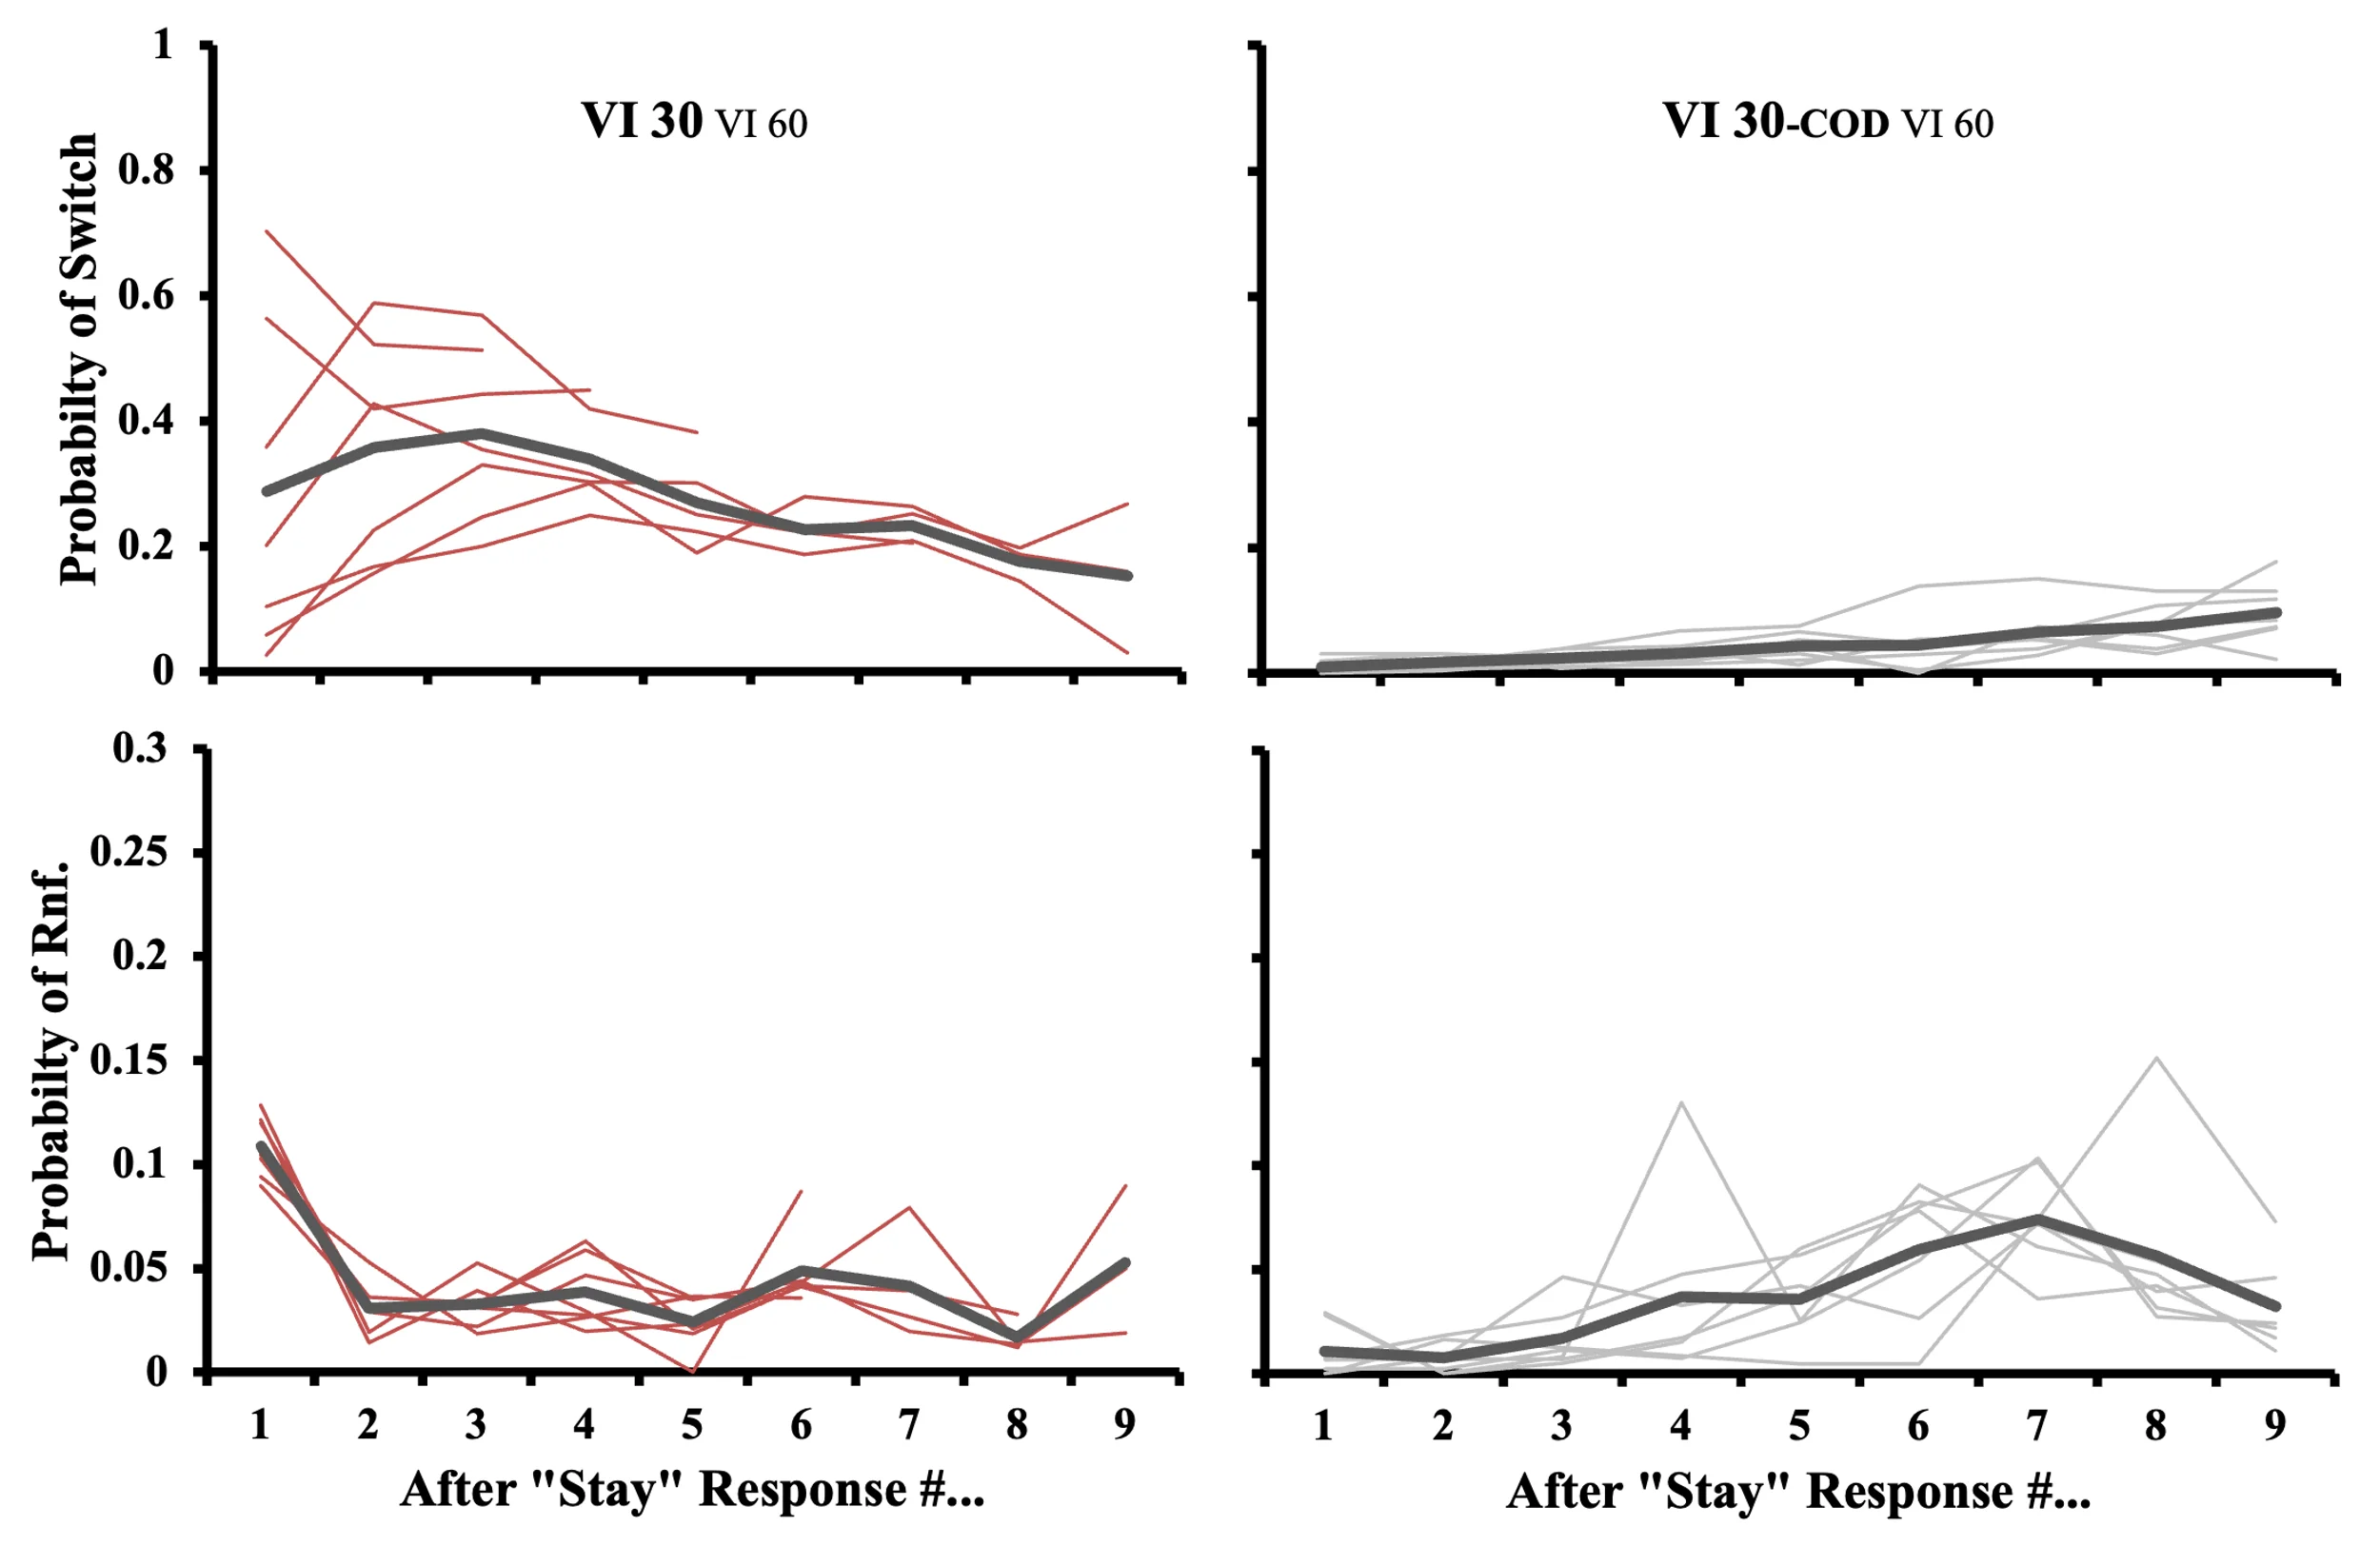
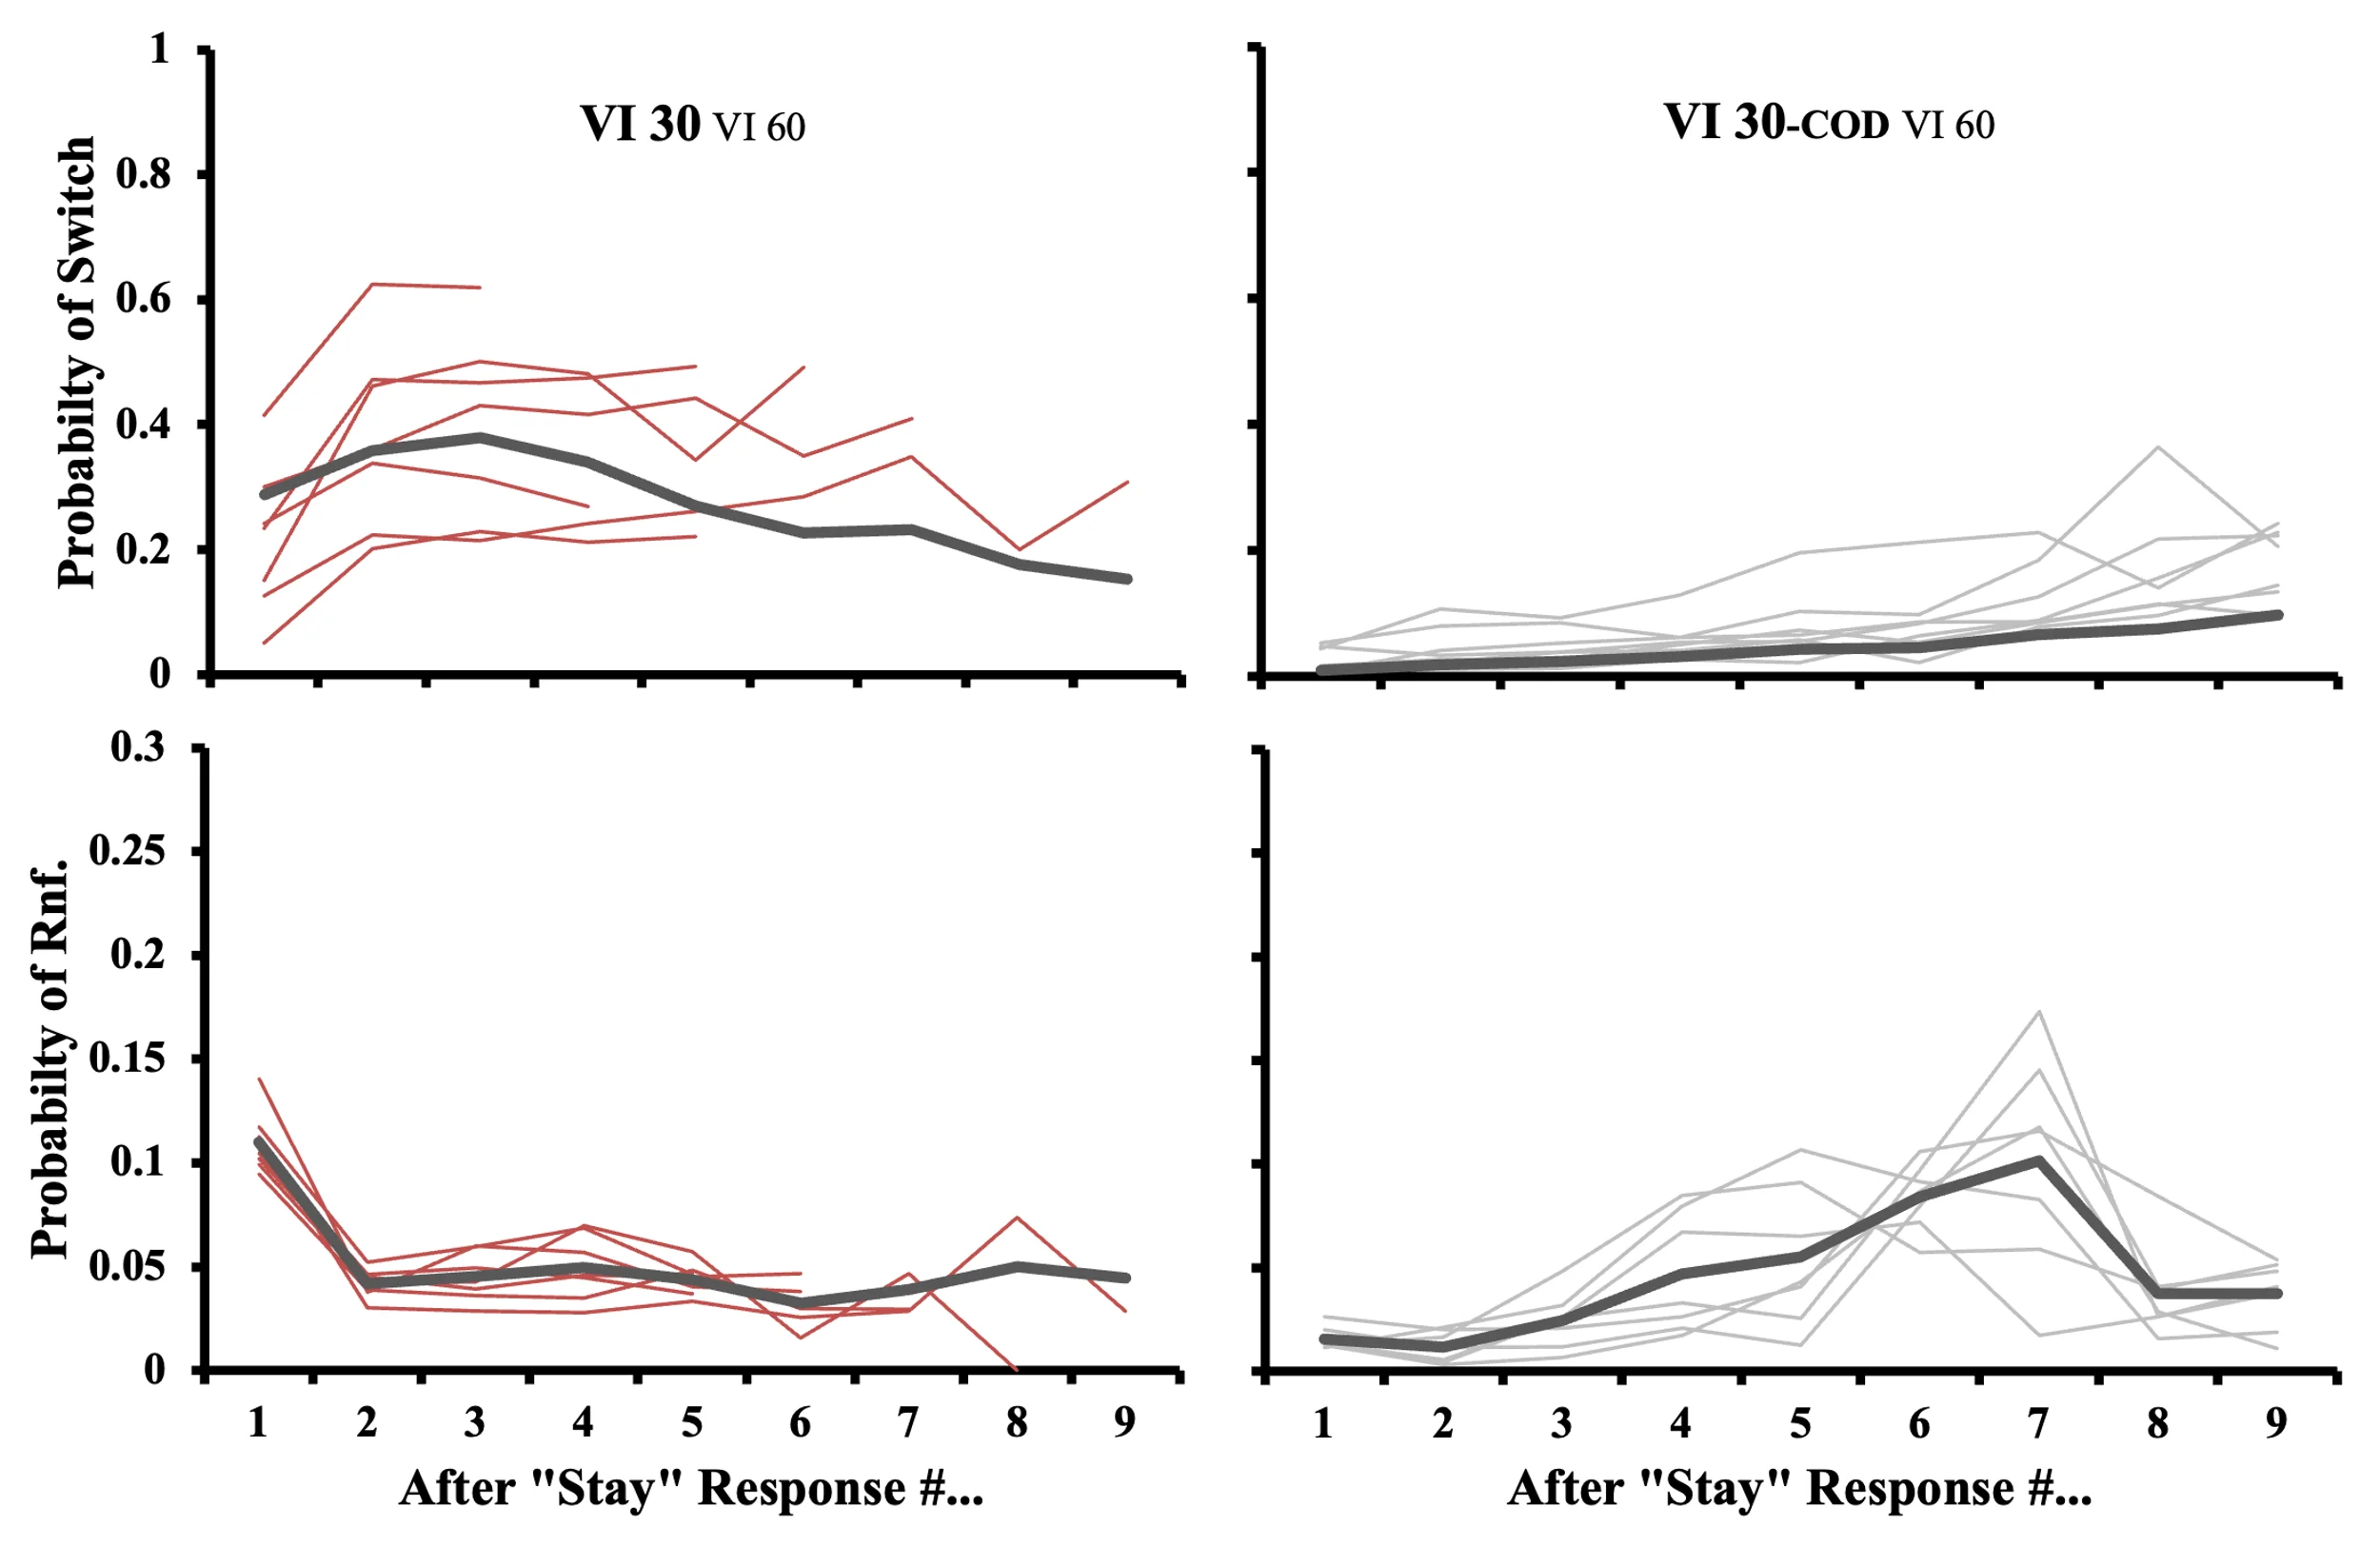
Figure 6 explores the peck-by-peck contingencies operative at the VI 30COD and the VI 30-s schedules. The figure provides the probability of a switch out of the two VI 30-s schedules after the 1st, 2nd, …, and 9th peck. Data were collected from the last five sessions of training prior to the first probe sessions. A minimum sample size of 20 was used as a filter. Responding at the VI 30-s schedule shows switch probabilities that rise from 0.29 after the first peck at the schedule to 0.38 after the third, before gradually declining with more responses. The response structure at the VI 30COD schedule was qualitatively different. When beginning their responding at this schedule, birds essentially did not switch after the first response (Mp(switch) = .001) and only gradually increased the average likelihood of switching to 0.10 by the 9th peck.

Figure 6
Peck-by-Peck Analyses (Expt. 1)

A four-panel line chart comparing pigeon responding under VI 30 VI 60 (left, red lines) and VI 30-COD VI 60 (right, gray lines) schedules. Top panels plot Probability of Switch and bottom panels Probability of Reinforcement against "After 'Stay' Response #" (1–9). Without a COD, switch probability peaks early then declines; with a COD, switch probability stays near zero, rising slightly. Reinforcement probability curves differ correspondingly, with bold lines showing group means.

Figure 6 also suggests that the differences in responding to the two VI 30-s schedules somewhat tracked the probabilities of reinforcement after each peck to the schedule. At the VI 30-s schedules, the average highest probability of reinforcement (p = .10) occurred after the first response to the schedule. After this, reinforcement probabilities settled into a consistent ~p = .04 for each subsequent peck. The reinforcement contingencies at the VI 30COD schedule were quite different. Here, the probability of reinforcement was lowest (p = .01) after the first response to the schedule and peaked after the 7th response (p = .07). Given that CODs held potential reinforcement until 2.5 s after a peck to a switch key, Figure 6 suggests that on average birds were “exiting” the COD at roughly the 7th schedule key peck, although there is a range of individual differences shown in the graph.

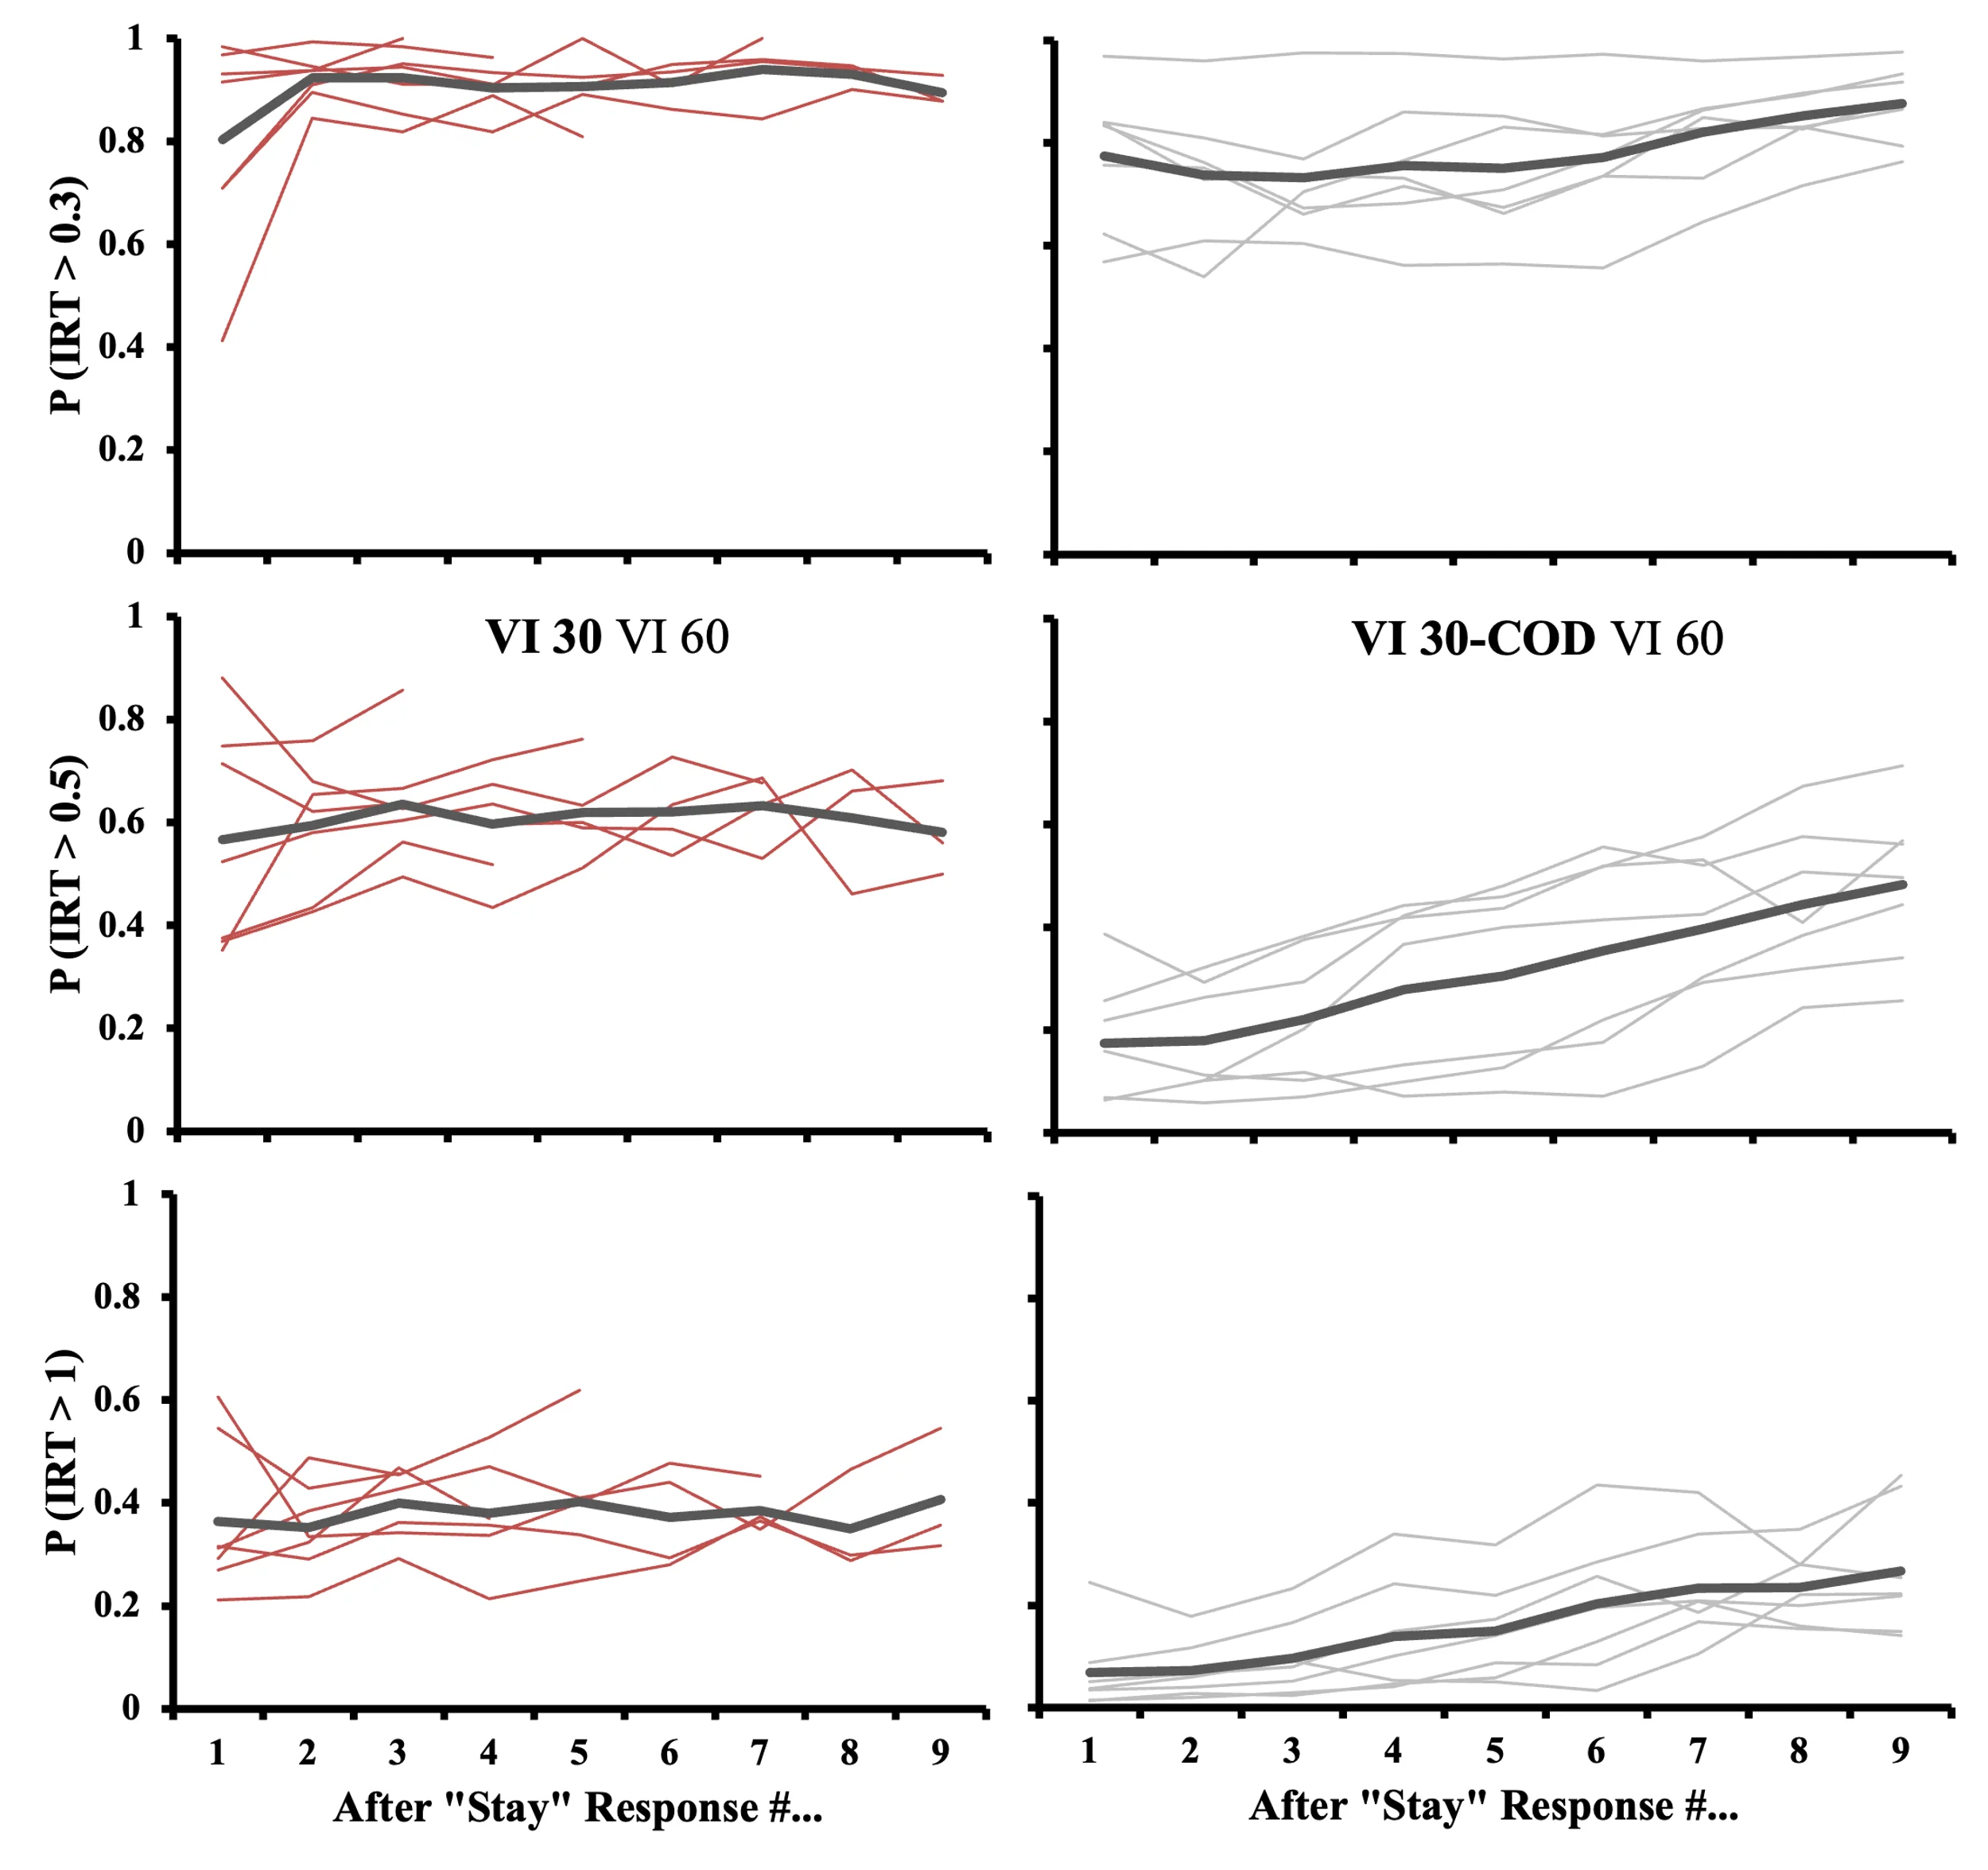
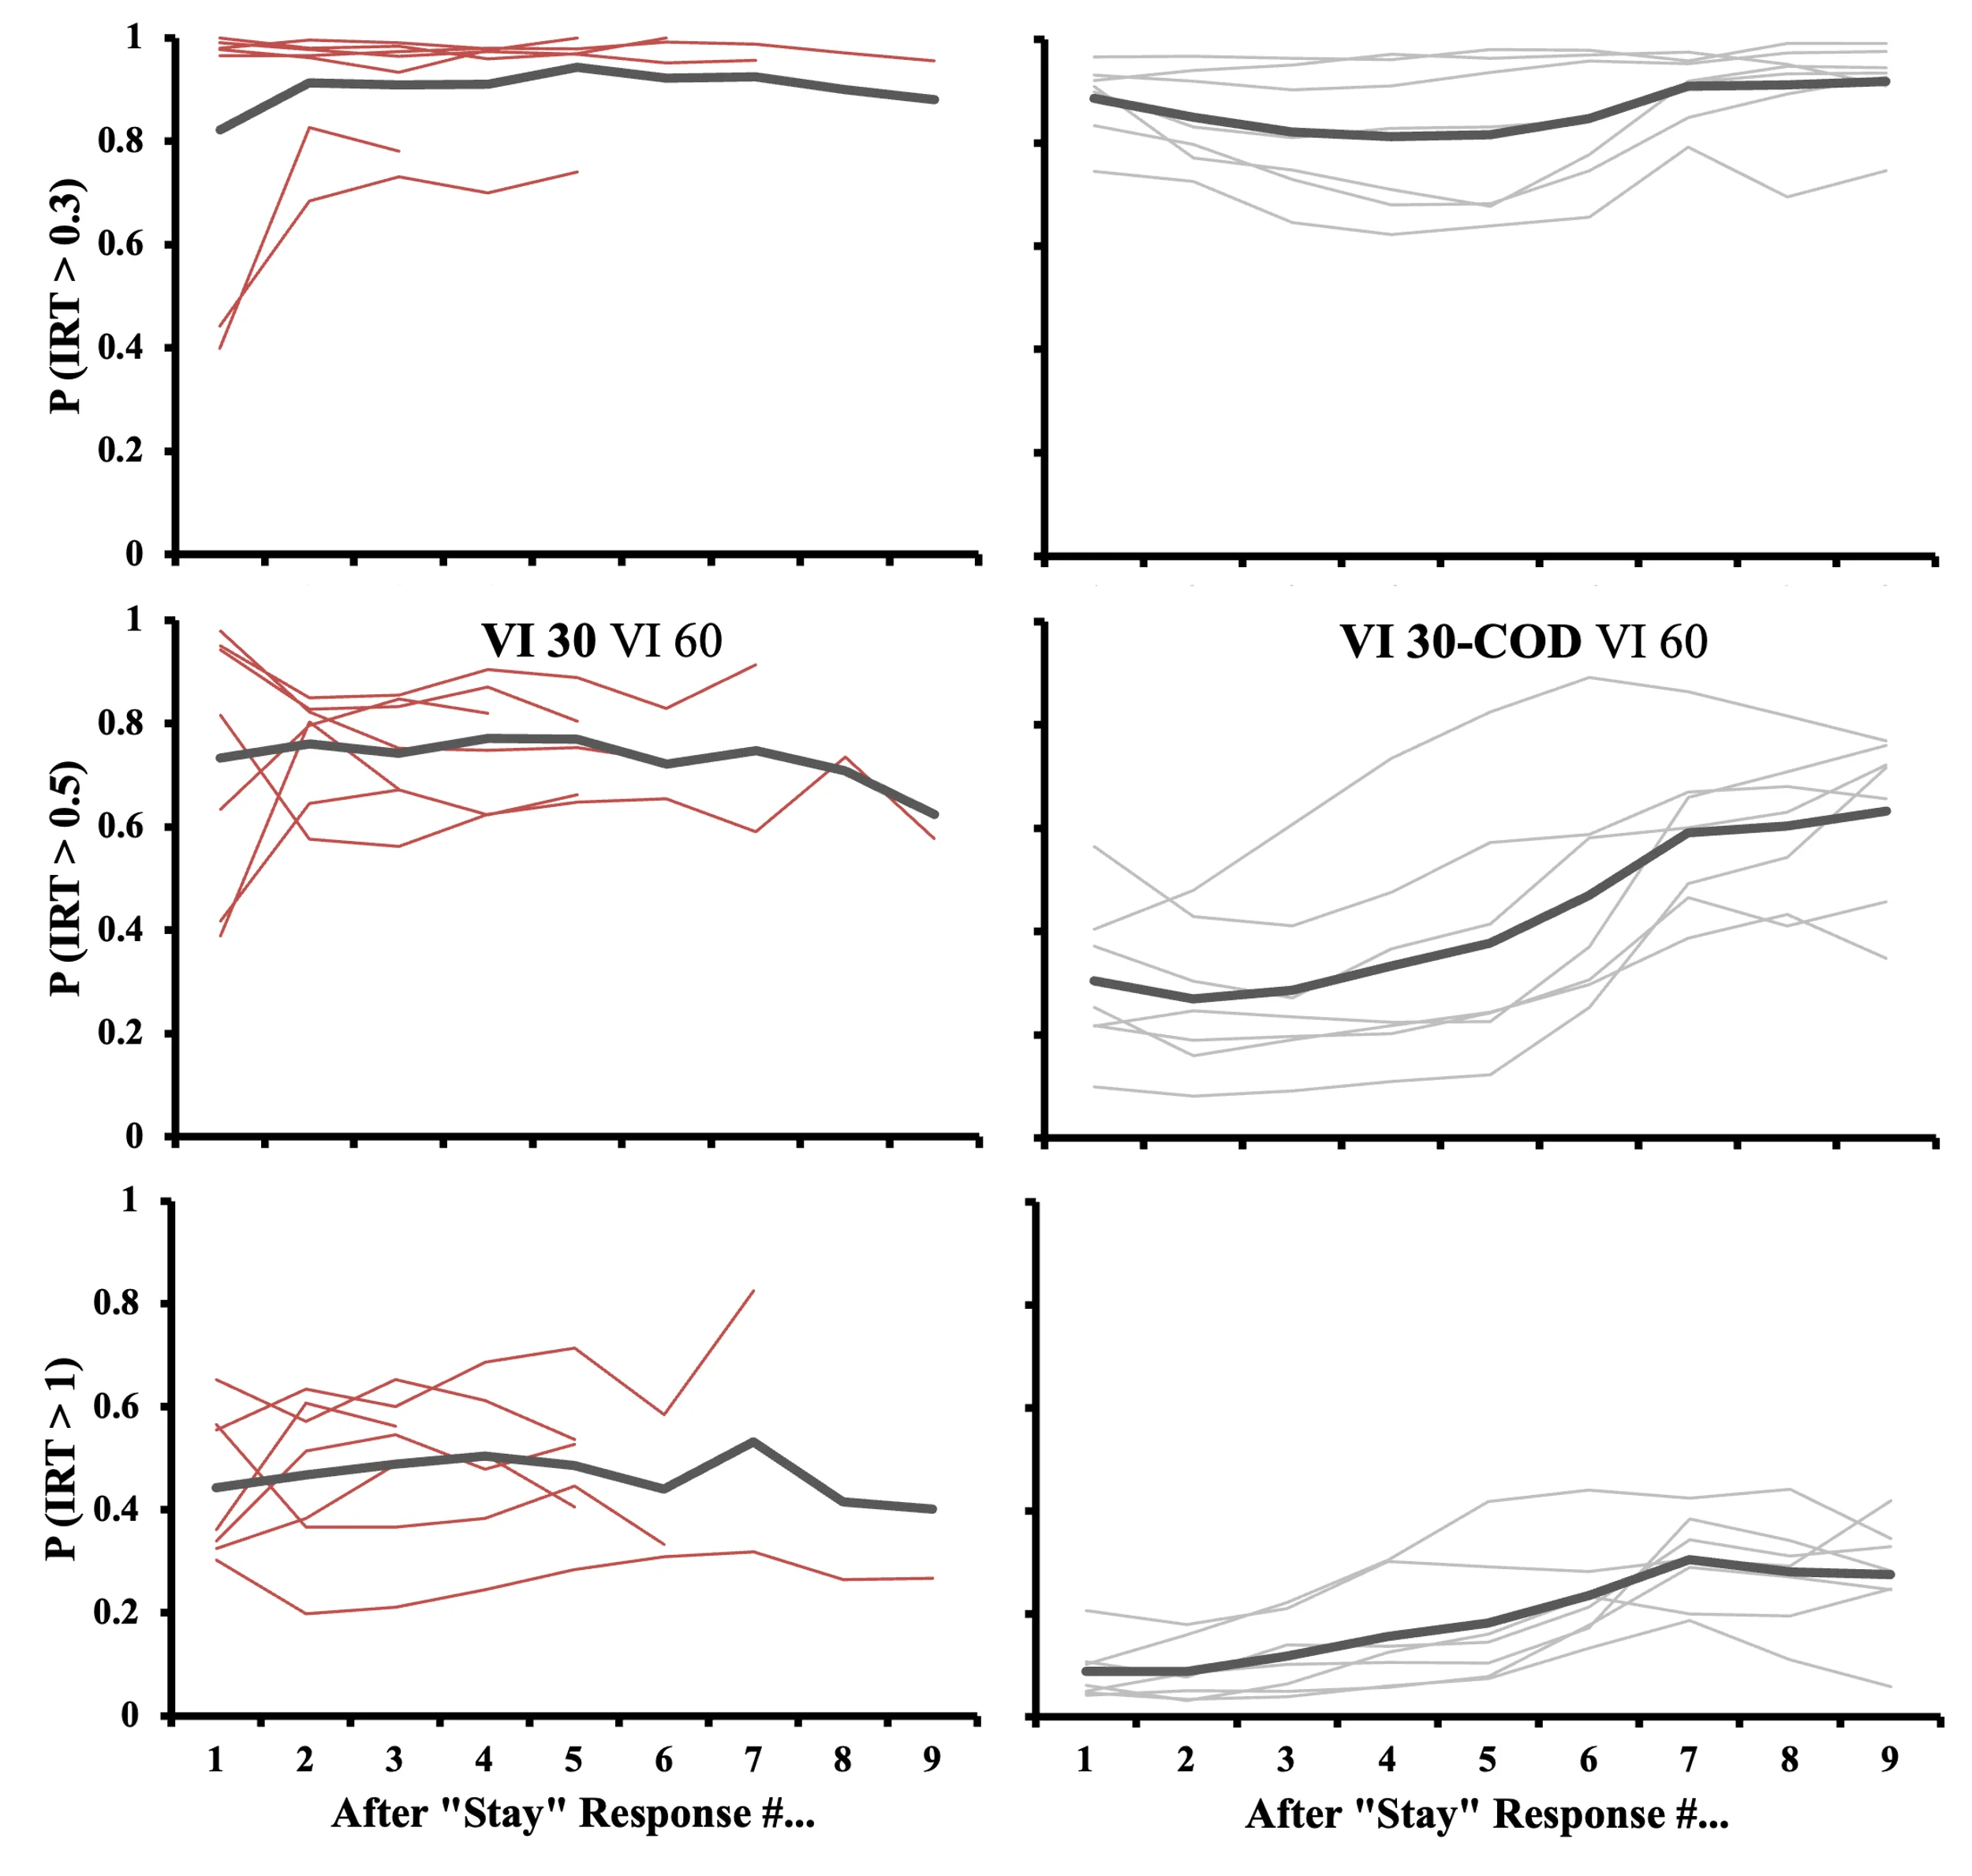
Thus far, our data have shown rate, dwell, and switch probability differences at the VI 30COD and the VI 30-s schedules. These differences seem to be particularly evident at shorter dwell times. Taken together, the data support the hypothesis that the switch into the VI 30COD consists of a single bout of responding. If a switch bout is present, we suggest that it would consist of short interresponse times (IRTs), followed by a relatively longer IRT when the bout ended. Figure 7 tests this prediction by examining the probability that IRTs are greater than 0.3 s (top panel), 0.5 s (middle panel), and 1.0 s (bottom panel) after the 1st, 2nd, …, and 9th response at the schedule. For responses to the VI 30-s schedule, as the filter for longer IRTs is increased, there is an equal probability of seeing IRTs of that length after each subsequent response at the schedule. At the VI 30COD schedule, a much different pattern is evident. Namely, as the IRT threshold is raised, longer IRTs do not appear until after some number of responses at the schedule.

Figure 7
Switch Bout Analysis for VI 30COD and the VI 30-s Schedules (Expt. 1)

A six-panel line chart comparing conditional probabilities of inter-response times (IRT) against "After 'Stay' Response #..." (1–9) for pigeons under VI 30 VI 60 (left, red lines) versus VI 30-COD VI 60 (right, gray lines). Rows show P(IRT>0.3), P(IRT>0.5), and P(IRT>1). Dark averaged lines stay flat in non-COD panels but rise steadily across successive responses in COD panels, indicating that the changeover delay progressively chunked responding.
Note. In order to assess the existence of potential switch bouts at our two VI 30-s schedules, an interresponse time (IRT) “break” analysis was conducted. We measured the conditional probability of shorter versus longer IRTs given each peck once a bird had switched into the VI schedule. The top two plots indicate the conditional probability of an IRT > 0.3 s; the middle two plots indicate a conditioned probability of an IRT > 0.5 s; the bottom two plots indicate a conditional probability of an IRT > 1.0 s. Plots on the right are for data obtained from the VI 30COD schedule, while those on the left are for the VI 30-s schedule that did not have a programmed COD. Solid black lines indicate averages, and the thinner red and grey lines are the data for individual birds. Note that we required an n = 20 to calculate probabilities, and such a sample was not obtained for all birds at each peck number.

Taken together, Figures 4 – 7 support the hypothesis that one of the effects of a COD is to produce a switch bout, i.e., a response chunk, when a bird selects the schedule with the COD that is operative. As noted earlier, such an analysis is exploratory rather than based on an a priori bout-boundary criterion. Namely, switches into the VI 30COD schedule showed the qualitative features expected of a switch bout: an initial run of short IRTs and low switch probabilities followed by a later transition toward longer IRTs or increased switching. The existence of a switch bout would lead to the prediction that during probe tests, a peck preference for the VI 30COD stimulus over the VI 30-s schedule would occur (see Figure 1). We observed the opposite.

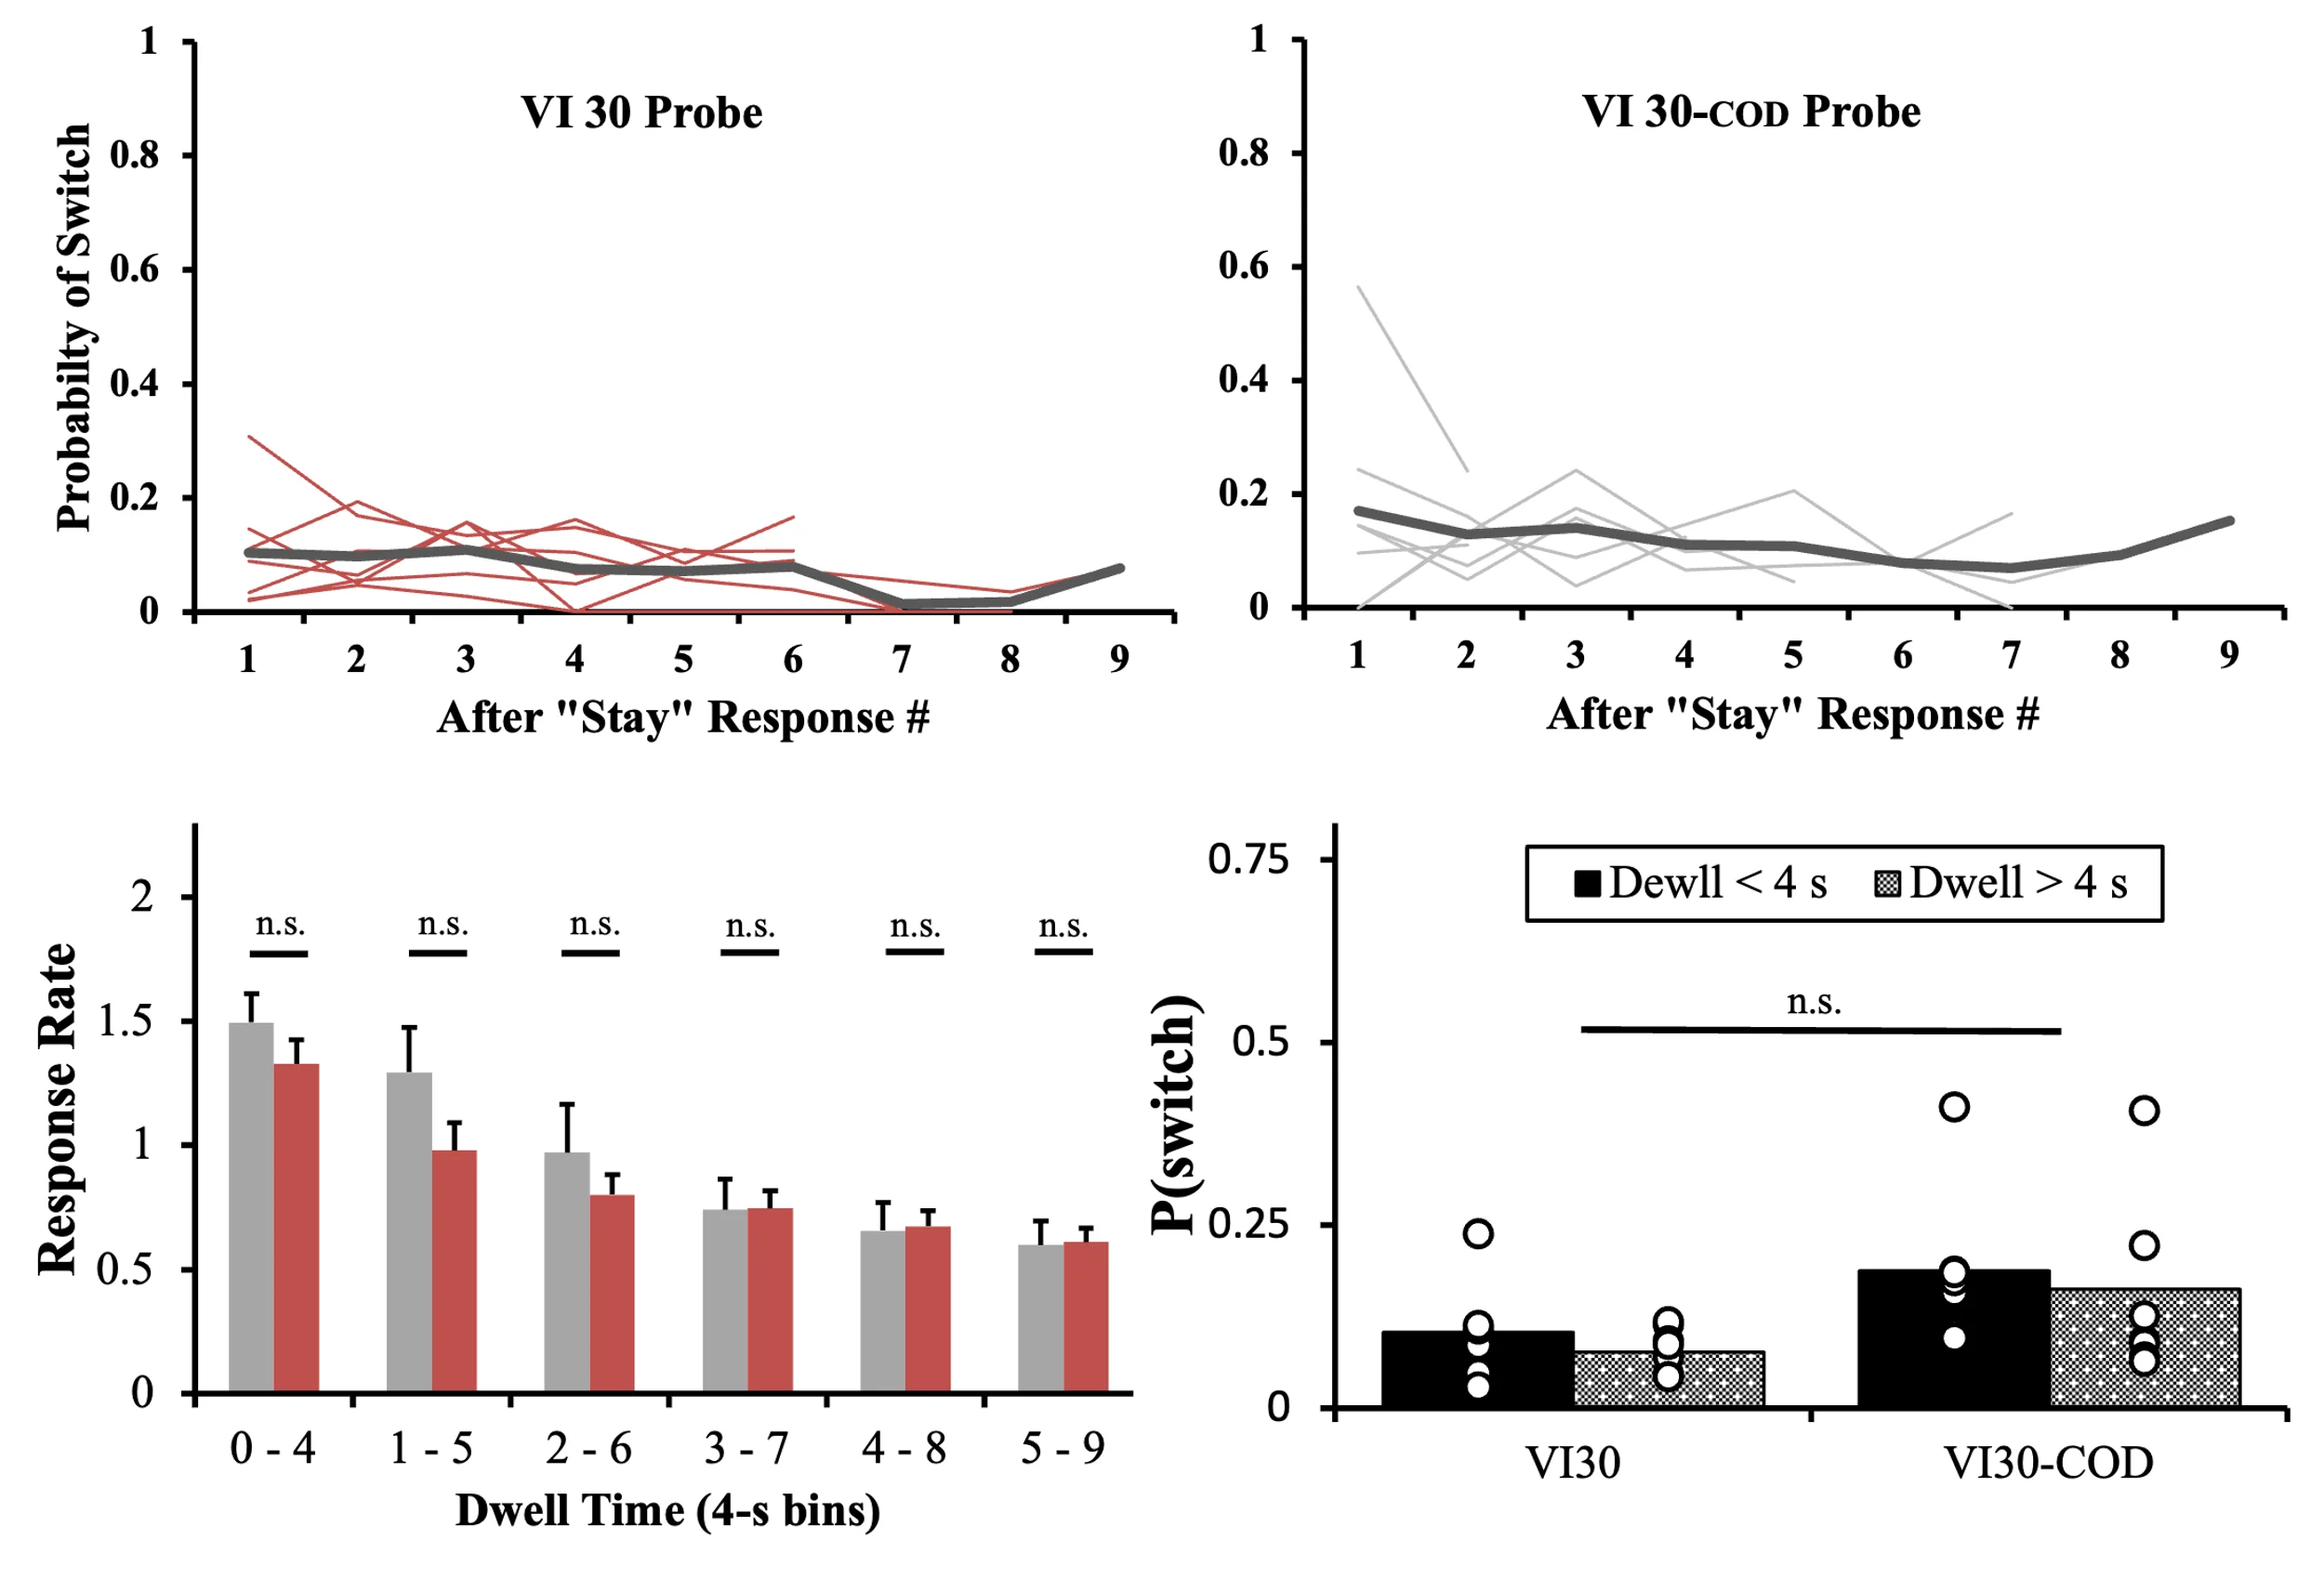
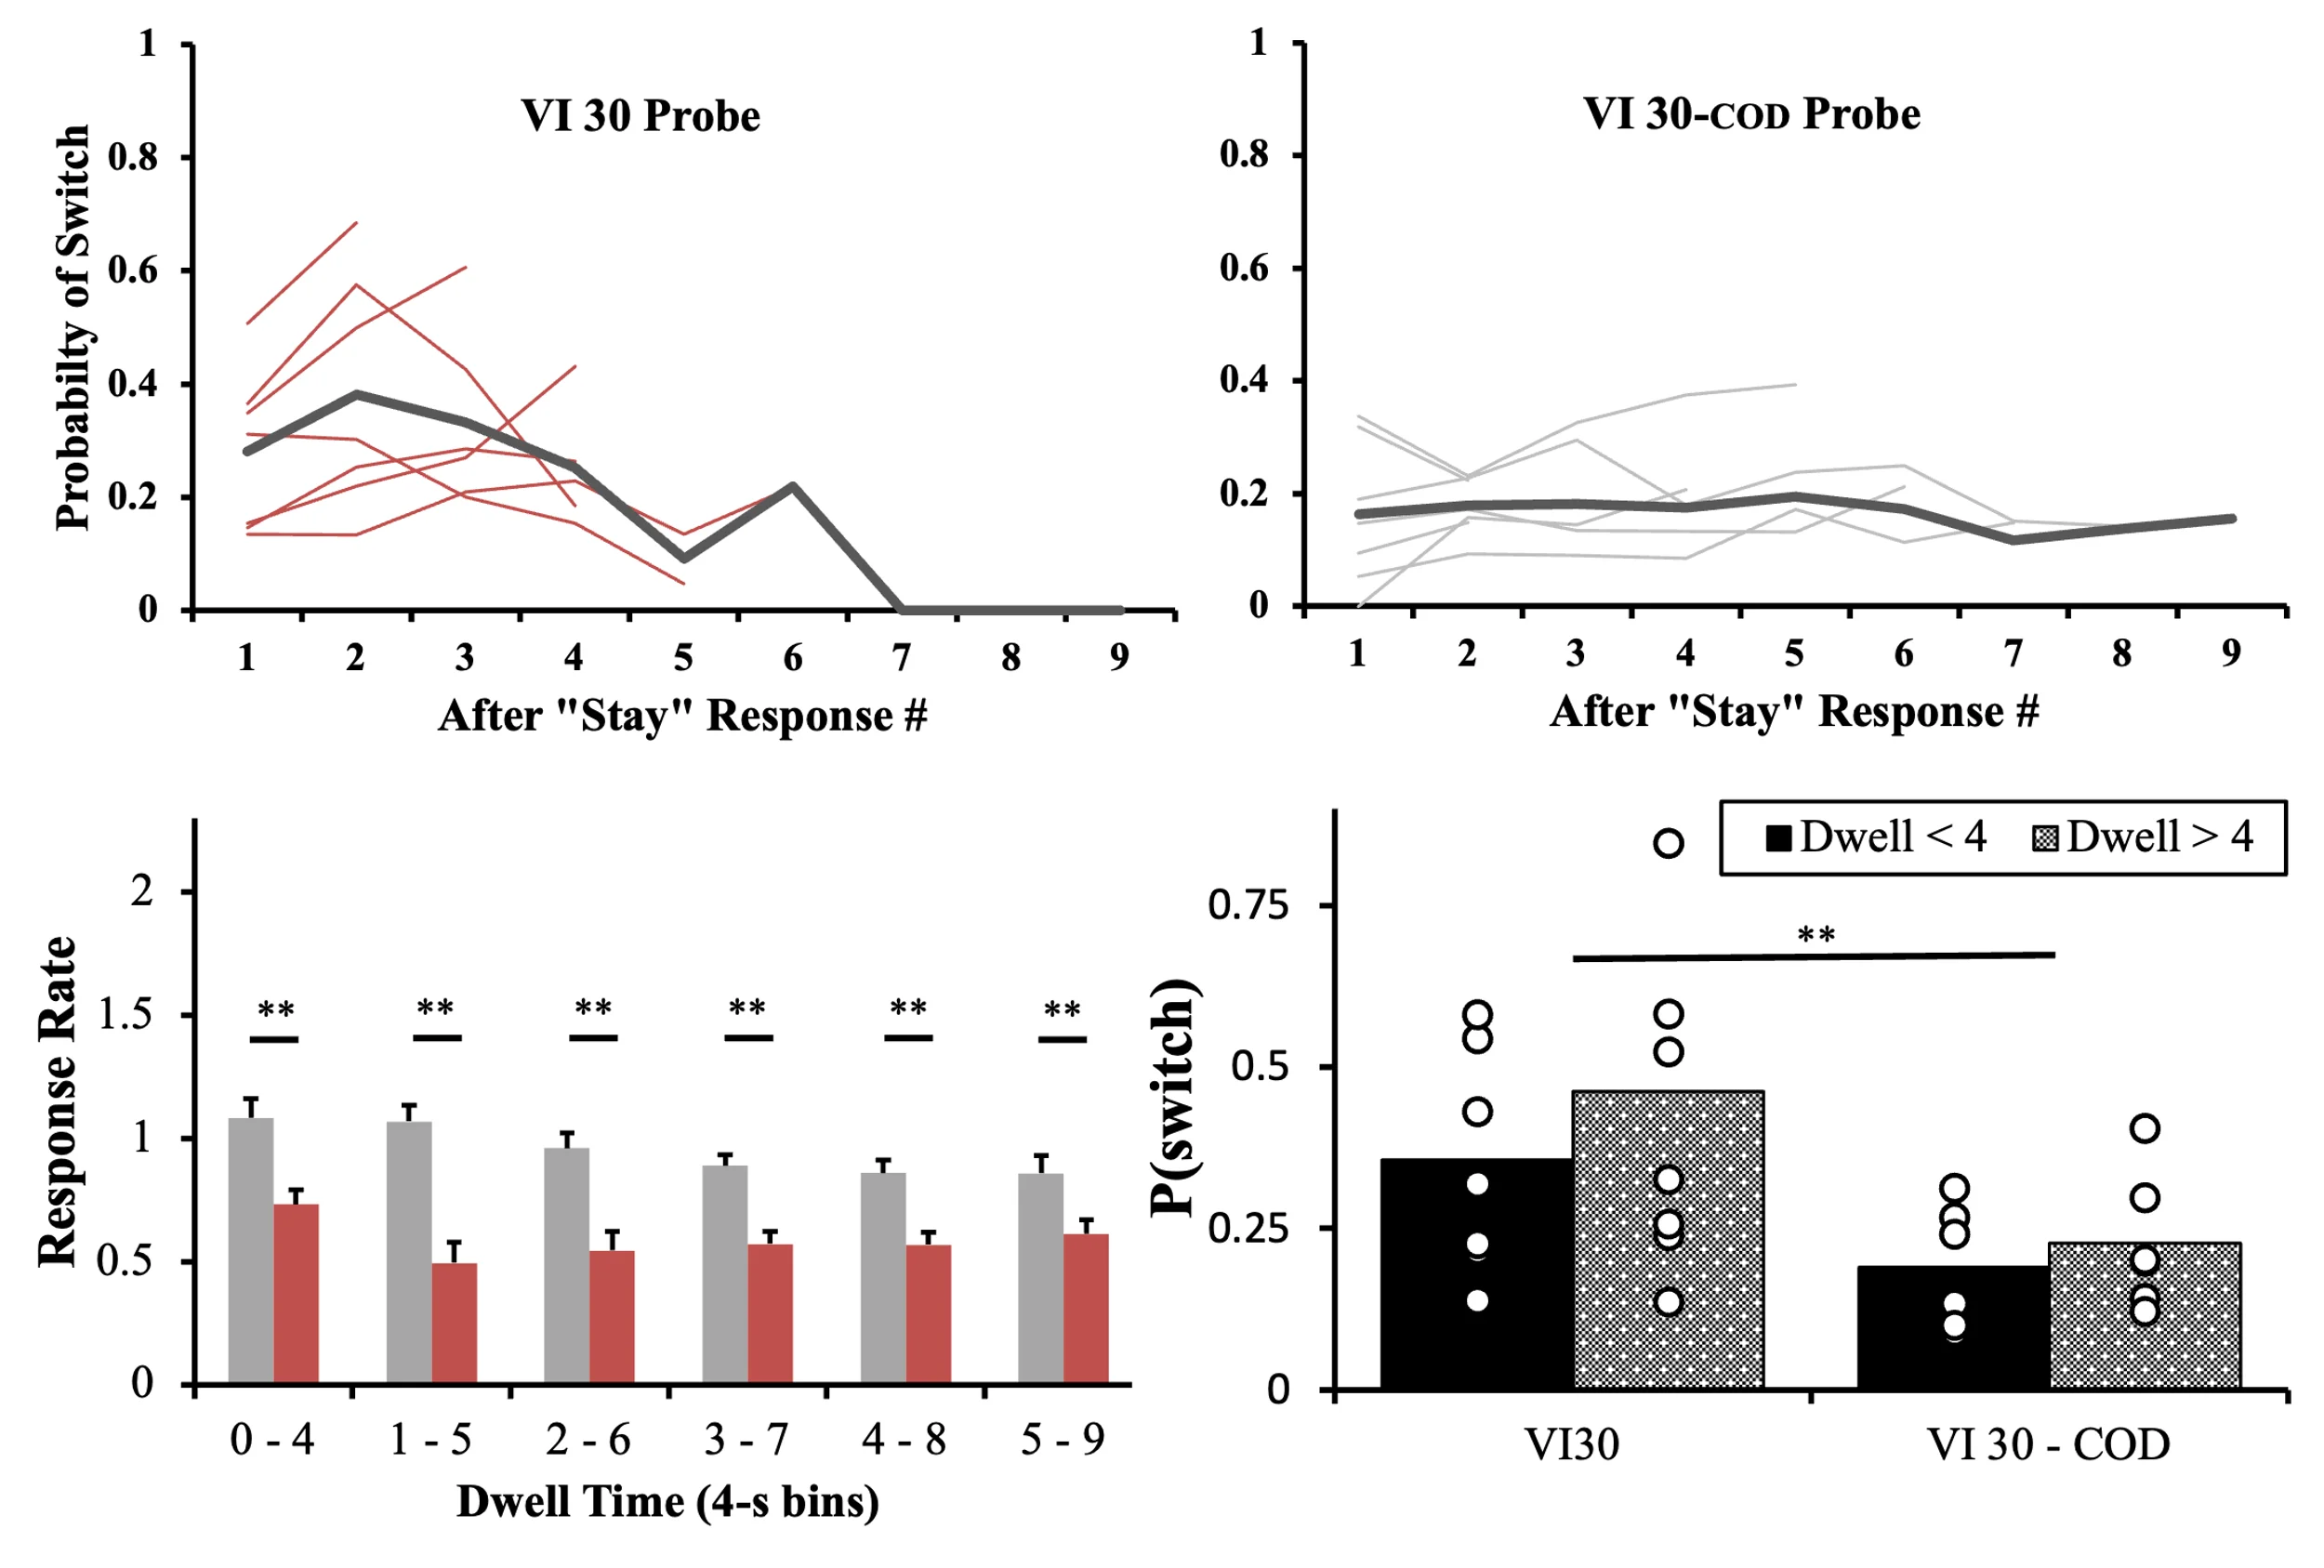
Figure 8 provides evidence suggesting that during our probe trials we lost stimulus control over the hypothetical switch bouts that had been established during training. The analyses in Figure 8 come from the four probe sessions and are restricted to the probe trials within these sessions. The two plots at the top of the figure provide the peck-by-peck probabilities of a switch in the presence of the VI 30 and the VI 30COD stimulus, respectively. In contrast to Figure 6, we see no clear difference in the likelihood of switching out of a schedule as the number of pecks made to the schedule increases. Similarly, the plot relating dwell times to switch probabilities shows that no statistical difference was observed in response rate as the dwell time increased at each probe stimulus. At both probe stimuli, response rates were higher at the start of responding and gradually decreased. However, no difference was observed in the response rates between the two VI 30 probes, MANOVA Pillai’s Trace, F(2, 11) = 3.55, p = .06. Finally, we provide the probability of a switch at early (< 4 s) and later (> 4 s) dwell times at the probe stimuli. Again, and in contrast to the data obtained from training, during probe trials no significant differences were observed between the VI 30COD stimulus and the VI 30 stimulus in switch probabilities as a function of dwell time, MANOVA Pillai’s Trace, F(2, 11) = 3.03, p = .09.

Figure 8
Probes and Stimulus Control (Expt. 1)

A four-panel chart showing pigeon switching behavior during probe trials. Top panels plot Probability of Switch (y-axis, 0–1) against After "Stay" Response # (1–9) for VI 30 Probe (red lines) and VI 30-COD Probe (gray lines), both showing low, relatively flat probabilities near 0.1. Bottom-left shows Response Rate declining across Dwell Time 4-s bins, all differences marked non-significant. Bottom-right compares P(switch) for VI30 versus VI30-COD across dwell durations under and over 4 seconds, with overlaid individual data points and a non-significant marker.
Note. Figure 8 provides data that assesses whether the stimuli used in our probes maintained stimulus control over the patterns of responding observed during training. All data comes from VI 30 VI 30COD probe trials, and replicates measures obtained from training: peck-by-peck switch probabilities after switching into a probe schedule stimulus (top two plots), a moving average of response rates with increasing dwell times at a probe schedule stimulus (lower left plot), and the probability of a switch at short versus long dwell times at a probe schedule stimulus (lower right plot). All error bars indicate standard error. Open circles indicate obtained data for individual birds.

Discussion

Experiment 1 utilized a multiple concurrent VI 30-s VI 60-s and VI 30COD VI 60-s schedule design for training. During testing, stimuli associated with the VI 30-s schedule and the VI 30COD schedule were paired as novel probe trials. The main results after 30 sessions of training consisted of:

  1. Relatively more extreme preference for the VI 30COD in comparison to the VI 30-s schedule (see Figure 3).
  2. Relatively longer dwell times at the VI 30COD and its paired VI 60-s schedule (see Figure 4).
  3. Relatively low switch probabilities out of the VI 30COD as compared to the VI 30-s schedule, especially early in both dwell times and response runs (see Figures 5 and 6).
  4. Evidence of bursts of short interresponse times (IRTs) after switching into the VI 30COD schedule as compared to the VI 30-s schedule (see Figure 7).

We believe that these data are consistent with the hypothesis that our subjects exhibited a response chunk – a switch bout – during concurrent VI 30COD VI 60-s training but not during concurrent VI 30 VI 60-s training. We hypothesize that this learned switch bout is restricted to instances when a bird switches from the VI 60-s into the VI 30COD schedule. Such a functional unit would account for the high rate of responding at the VI 30COD when subjects first entered the schedule and the low probability of switches out of the VI 30COD when subjects first entered the schedule as compared to later in the dwell time or response run. A learned switch bout associated with switching into the VI 30COD schedule would also account for the more extreme preference we observed for the VI 30COD relative to the VI 30-s schedule (see Figure 1). We found this preference difference when it was measured in terms of discrete stay responses.

We should note, though, that no such preference difference was observed between the VI 30COD and the VI 30-s schedule when preference was measured in terms of relative dwell times. The reason for this is that the COD programmed on switches into the VI 30COD also, paradoxically, yielded longer dwell times at its paired VI 60-s schedule. This resulted in no significant change in relative dwell times when comparing the VI 30COD and the VI 30-s schedules.

Despite multiple lines of evidence supportive of a s switch bout restricted to the VI 30COD schedule, the main finding from our probe trials did not support the existence of this hypothesized response chunk (see Figure 3). We predicted that when the VI 30COD and VI 30-s stimuli were paired, subjects would show a response-based preference for the VI 30COD. Instead, the measured response-based preference favored the VI 30-s stimulus by approximately 2:1. Additionally, we predicted no preference would appear when measured in terms of dwell times. Instead, the birds favored the VI 30-s stimulus by approximately 2:1 in terms of relative dwell times as well.

However, our original prediction was predicated on the carrying over of learned contingencies from training to probe sessions. That is, we assumed that training would establish discriminative stimulus control over switch, switch bout, and stay responses, and that our probes would carry over this stimulus control. Data from Figure 8 suggests this was not the case. Therefore, it is unclear what exactly our probe sessions are testing regarding our central hypothesis. We believe that a potential explanation for the observed preference for the VI 30-s stimulus relative to the VI 30COD stimulus can be provided based on local rates of reinforcement, which is considered further in the General Discussion. Experiment 2, however, was designed to address the issue of stimulus control during the probe sessions.

Experiment 2

Experiment 2 is largely identical to Experiment 1 with one change. The experimental design was slightly modified in an effort to strengthen the potential carry-over of stimulus control established during training to probe testing. As in Experiment 1, we trained subjects under multiple concurrent VI 30-s VI 60-s schedules. In one concurrent schedule, a COD was programmed for the VI 30-s schedule. Our modification is shown in Figure 9 and concerns how birds switched between paired concurrent VI VI schedules. In contrast to Experiment 1, Experiment 2 utilized a classic Findley procedure. A generic “switch key” allowed subjects to alternate between two concurrent schedules operative at a single “schedule key”.

Figure 9
Experiment 2 Design

A schematic diagram showing experimental contingencies for pigeon concurrent VI VI schedules across Training Trials and Probe Trials. Two-color split circles represent stimulus keys: red/green (VI 30/VI 60) paired with a COD box, and yellow/blue (VI 60/VI 30) without. Solid and dashed arrows depict stay responses (self-loops) and switch responses toward a "VI switch" key. Probe Trials combine red and blue VI 30 stimuli.
Note. The figure provides a visualization of the basic experimental design utilized in Experiment 2. Experiment 2 was conducted in a manner identical to Experiment 1. However, a 2-key Findley procedure was used. The switch key here was always white – a color not associated with any of the VI schedules. Pecks to the switch key alternated the color of the schedule key between the paired stimuli associated with the assigned VI schedules.

In Experiment 1, by giving each schedule a distinct switch key, probes produced a unique stimulus environment in which the paired switch-key stimuli were novel. Whether this accounts for the apparent loss of stimulus control we observed in Experiment 1, we do not know, but by using a traditional Findley procedure in Experiment 2, we remove this confound. In a traditional Findley procedure, the single switch-key stimulus is common across all VI schedules. Therefore, at any given moment within a concurrent VI VI schedule, a subject is presented with a schedule-key stimulus and the common switch-key stimulus. Thus, whether the schedule-key stimulus occurs during training or a probe, the external stimulus environment will be identical – a common switch stimulus and a single VI schedule stimulus displayed together.

Our predictions for Experiment 2 were identical to those proposed for Experiment 1. First, we assumed that one function of a COD is to train a switch bout to the VI schedule for which the COD is programmed. Therefore, we predicted evidence for a switch bout would appear for the VI 30COD schedule and not the VI 30-s schedule. Secondly, we predicted that during probes, subjects would show a peck-based preference for the VI 30COD stimulus over the VI 30-s stimulus (see explanation in Figure 1).

Method

Subjects

Seven adult pigeons (White Racing Homing, WhitePigeonSales.com) were used for this experiment. These birds were not used in Experiment 1. Birds were housed and cared for as described in Experiment 1.

Apparatus

Experiment 2 used the same operant chambers described in Experiment 1. However, the right-most peck key was removed, leaving each chamber with two response keys. All other aspects of the operant chambers remained unchanged from Experiment 1.

Procedure

The procedure for Experiment 2 was identical to that used in Experiment 1 with the exception that a two-key Findley procedure was employed. In addition, five training sessions separated the probe sessions, rather than the 10 used in Experiment 1. All birds underwent autoshaping, alternation training, followed by 30 sessions of multiple, concurrent VI 60-s VI 30-s training. As with Experiment 1, the two VI 60-s VI 30-s concurrent schedules differed only in that a 2.5-s changeover delay (COD) was attached to one of the VI 30-s schedules (VI 30COD). The COD was triggered by a peck to the white switch key. During the COD, interresponse times (IRTs) accumulated normally across all VI schedules, but a programmed reinforcement delivery to the VI 30COD was held until the first post-COD schedule key peck. Probe sessions were run in a manner identical to that used in Experiment 1. By the end of the experiment, each bird had experienced 16 total VI 30COD probe trials of 90 s each.

Results

In Experiment 2 the final five sessions of training provided an average of 10139.2 responses per subject for analysis. During training, within their concurrent pairings, all subjects showed a preference for the VI 30-s and VI 30COD schedules. However, the preference was more extreme for the VI 30COD schedule. Figure 10 provides the proportion of schedule-key pecks made at both the VI 30 and VI 30COD stimuli during the final five VI 30 VI 60-s and VI 30COD VI 60-s training sessions that preceded the first set of probe sessions. Proportions were calculated identically to Experiment 1 in terms of schedule responses and dwell times.

Birds showed a significantly more extreme preference for the VI 30COD schedule when preference was calculated in terms of schedule responses, MVI30cod = .80, SE = .07; MVI30 = 0.65, SE = .09; t(6) = 3.66, p = .01. No significant difference was observed between the two VI 30-s schedules when preference was calculated in terms of relative dwell times, MVI30cod = .60, SE = .08; MVI30 = .60, SE = .03; t(6) = .34, p = .98. During the probe trials, birds showed close to a 2:1 preference for the VI 30COD stimulus over the VI 30 stimulus – the opposite result to that observed in Experiment 1. However, this only applied to the response measure of preference, Mresp = .62, SE = .07; Mdwell = .53, SE = 0.01.

Figure 10
Preference During Training and Probe Trials (Expt. 2)

A two-panel bar chart showing pigeon response proportions during concurrent VI schedules. The left panel plots Proportion VI 30 (y-axis, 0–1) for Peck versus Dwell responses across VI30 and VI30-COD training conditions, with overlaid individual data points and significance markers (* and **). Preference is higher for VI30-COD (~0.8). The right panel shows stacked Peck Proportions and Dwell Time Proportions during VI 30 VI 30-COD probe trials, with error bars near 0.4–0.46.
Note. Baseline relative responding to the VI 30-s schedules with (red) and without COD (grey). Relative peck-based proportions are given by solid shading. Relative dwell-based proportions are given by the hatched shading. Baseline proportions were calculated over the last five training sessions. Probe proportions were calculated during the four probe sessions in which the stimuli associated with the VI 30COD and VI 30 schedules were paired. Open circles indicate obtained proportions of the individual birds.

Figure 11 provides an analysis of COD effects on molecular response structure during training. All analyses were drawn during the final five training sessions that preceded the first set of probe sessions. Figure 11 provides the average dwell times observed in the two VI 30-s schedules and their paired VI 60-s schedules. The VI 30COD VI 60-s schedule pairing produced dwell times that were significantly greater than those observed in the VI 30 VI 60-s pairing (MVI30cod = 8.92 s, SE = .59; MVI30 = 4.66 s, SE = .58, t(6) = 8.44, p < .001; MVI60cod = 5.65, SE = .84; MVI60 = 3.24 s, SE = .33, t(6) = 2.80, p = .03). Figure 11 also provides a 4-s moving average for the first 9 s that a bird spent responding to the schedule key. As seen in Experiment 1, the VI 30COD schedule produced a relatively high rate of responding that decreased with time spent at the schedule, from M = 1.73 rsp / s to M = .73 rsp / s). The response rate to the VI 30-s schedule, however, remained slower and largely flat as dwell time increased, from M = .82 rsp / s to M = .59 rsp / s. These differences were highly significant (MANOVA – Pillai’s Trace, F(6,7) = 62.40, p < .001), though the difference disappeared by the 5 – 9-s bin (Univariate ANOVA F(1,12) = 2.39, p = .14). Conversely, no difference in response rates was observed between responses made to the two VI 60-s schedules (MANOVA – Pillai’s Trace, F(6,7) = 2.55, p = .12).

Figure 11
Average Dwell Times and Response Rates. (Expt. 2)

A four-panel bar chart from pigeon training on VI 30 VI 60 schedules. Left panels plot Average Dwell (s) with individual data points, showing VI30-COD significantly higher than VI30 (**), while VI60 versus VI60-COD is non-significant. Right panels plot Response Rate against Dwell Time (4-s bins), comparing COD (gray) and non-COD (red) conditions, revealing significantly elevated VI 30-cod rates in early bins but negligible VI 60 differences.
Note. On the left average absolute dwell times are provided for each reinforcement schedule. Red indicates the VI 30 VI 60-s pair and grey indicates the VI 30COD VI 60-s pair. On the right a moving average of response rates is provided as the dwell time increases from 0 to 9 s. Error bars indicate standard errors. Open circles indicate obtained averages of the individual birds.

Figure 12 provides the probability of a switch out of a schedule during the first 4 s of dwell time versus dwell times greater than 4 s. The data resembles that obtained in Experiment 1. Birds were overall significantly less likely to switch out of the VI 30COD schedule when compared with the VI 30-s schedule (MANOVA, Pillai’s Trace F(2,11) = 16.11, p < .001). Relatedly, when responding to the VI 30COD schedule, birds were significantly less likely to switch out during the first 4 s of responding in comparison to longer dwell times (t(6) = -6.02, p < .001). In contrast, when responding to the VI 30-s schedule, there was no significant difference in the probability of switching out of the schedule at short vs. longer dwell times (t(6) = -1.31, p = .24). Similarly, the probability of switching out of either of the VI 60-s schedules did not significantly change with dwell time at the schedule (MANOVA, Pillai’s Trace F(2,11) = .99, p < .40).

Figure 12
Dwell Times and Switch Probabilities. (Expt. 2)

A pair of bar charts showing switch probability P(switch) on the y-axis for pigeons under VI schedules with and without changeover delays (COD). Left panel compares VI30 and VI30-COD; right panel compares VI60 and VI60-COD. Black bars denote Dwell less than 4 responses, dotted bars Dwell greater than 4, with overlaid individual data points. Under VI30-COD, short-dwell switching drops sharply while long-dwell switching rises, marked by significant differences (**).
Note. The figure shows the probability of a switch from each reinforcement schedule at short (black bars, less than 4 s) and long dwell times (grey bars, greater than 4 s). Note that the VI 60-COD indicates the VI 60-s schedule paired with the VI 30COD schedule. Only the single VI 30COD schedule had a programmed COD attached to it. Only significant differences are indicated in the figure. Open circles are the obtained probabilities of the individual birds.

Figure 13 restricts its analysis to responding at the VI 30COD and VI 30 schedule and presents the peck-by-peck contingencies operative at these two schedules. Figure 13 provides the probability of a switch out of the two VI 30-s schedules after the 1st, 2nd, …, and 9th peck. Data was collected from the last 5 sessions of training prior to the first probe sessions, and a minimum sample size of 20 was used as a filter. The observed patterns are remarkably similar to those found in Experiment 1 (see Figure 6). Responding at the VI 30-s schedule shows switch probabilities that rise from M = .29 after the first peck at the schedule to 0.38 after the third, before gradually declining with more responses. At the VI 30COD schedule birds essentially did not switch after the first response (M = .001) and only gradually increased the average likelihood of switching to .10 by the 9th peck.

Figure 13
Peck-by-Peck Analyses. (Expt. 2)

A four-panel line chart comparing pigeon responding under VI 30 VI 60 (left, red lines) and VI 30-COD VI 60 (right, gray lines) schedules. Top panels plot Probability of Switch (0–1) and bottom panels Probability of Rnf. (0–0.3), both against After "Stay" Response # (1–9). Without COD, switch probability peaks early then declines; with COD, switch and reinforcement probabilities rise steadily, peaking around response 7, indicating longer response chunks.
Note. The figure provides the switch and reinforcement probabilities after each peck once a bird has entered a schedule. The top two plots provide switch probabilities, while the bottom two plots provide reinforcement probabilities. Plots on the right are for data obtained from the VI 30COD-s schedule, while those on the left are for the VI 30-s schedule that did not have a programmed COD. Solid black lines indicate averages, and the thinner red and grey lines are the data for individual birds. Note that we required an n = 20 to calculate probabilities, and such a sample was not obtained for all birds at each peck number.

Figure 13 also shows, as in Experiment 1, that the differences in observed switch probabilities at the two VI 30-s schedules tracked the contingencies of reinforcement after each peck to the schedule. At the VI 30-s schedule on average the highest probability of reinforcement (p = .11) occurred after the first response to the schedule. After this, reinforcement probabilities settled into a consistent ~p = .04 for each subsequent peck. The reinforcement contingencies at the VI 30COD schedule were quite different. Here, the probability of reinforcement was lowest (p = .01) after the first response to the schedule and peaked after the 7th response (p = .10).

As in Experiment 1 we further examined the possibility of a switch bout developing at the VI 30COD schedule via an IRT break analysis. We suggest that supporting evidence would consist of a burst of short interresponse times (IRTs), followed by a relatively longer IRT when the chunk ended. We would expect to see such a pattern for responding made to the VI 30COD schedule, but not to the VI 30-s schedule. Figure 14 tests this prediction by examining the probability that IRTs are greater than .3 s (top panel), .5 s (middle panel), and 1.0 s (bottom panel) after the 1st, 2nd, …, and 9th response at the schedule. For responses to the VI 30-s schedule, as the filter for longer IRTs is increased, there is an equal probability of seeing IRTs of that length after each subsequent response at the schedule. The observed pattern at the VI 30COD schedule is much different. Namely, as the IRT threshold is raised, longer IRTs do not appear until after some number of responses at the schedule. This varies from bird to bird, producing an average with a relatively linear increase up to the 7th response.

Figure 14
Switch Bout Analysis for VI 30COD and the VI 30-s Schedules. (Expt. 2)

A six-panel line chart comparing pigeon inter-response time probabilities across two schedule conditions, VI 30 VI 60 (left, red lines) and VI 30-COD VI 60 (right, gray lines). Rows plot P(IRT>0.3), P(IRT>0.5), and P(IRT>1) against "After Stay Response #" (1–9). Bold group-mean lines show COD panels rising steadily with successive responses, while non-COD panels stay relatively flat, illustrating COD-driven response chunking.
Note. In order to assess the existence of potential switch bouts at our two VI 30-s schedules, an interresponse time (IRT) “break” analysis was conducted. We measured the conditional probability of shorter vs. longer IRTs given each peck once a bird had switched into the VI schedule. The top two plots indicate the conditional probability of an IRT > 0.3 s; the middle two plots indicate a conditioned probability of an IRT > 0.5 s; the bottom two plots indicate a conditional probability of an IRT > 1.0 s. Plots on the right are for data obtained from the VI 30COD-s schedule, while those on the left are for the VI 30-s schedule that did not have a programmed COD. Solid black lines indicate averages, and the thinner red and grey lines are the data for individual birds. Note that we required an n = 20 to calculate probabilities, and such a sample was not obtained for all birds at each peck number.

Taken together, Figures 11 – 14 support the hypothesis that one of the effects of a COD is to produce a switch bout, i.e., a response chunk, to the schedule in which a COD is operative. This predicts that during probe tests, a peck preference for the VI 30COD stimulus over the VI 30-s schedule would be observed, and this is what we see in Figure 10. In Experiment 1 we inferred that the absence of this predicted finding was due to a failure of stimulus control carried over from training to testing. Do we see such stimulus control carried over in Experiment 2? Figure 15 addresses this question with an analysis that is restricted to the VI 30 VI 30COD probe trials.

The top two plots of Figure 15 provide the peck-by-peck probabilities of a switch in the presence of the VI 30 and the VI 30COD stimulus, respectively. Although run lengths tended to be short at the VI 30, the switch pattern is qualitatively similar to that see in Figure 13. The average switch probability rose from M = .28 after the first peck at the schedule to .38 after the 2nd, before gradually falling. Switch probabilities at the VI 30COD in contrast were not equivalent to those obtained during training. Rather than starting at essentially zero and slowly increasing with each subsequent peck, during VI 30COD probes switch probabilities remained flat across each schedule peck (~M = .18).

Figure 15
Probes and Stimulus Control. (Expt. 2)

A four-panel figure showing pigeon switching behavior during VI 30 and VI 30-COD probes. Top line graphs plot Probability of Switch versus After "Stay" Response # (1–9), showing higher, peaked switching (~0.4) in VI 30 versus flatter, lower switching (~0.2) in VI 30-COD. Bottom-left bar chart shows Response Rate across Dwell Time bins with significant differences (**). Bottom-right bars compare P(switch) for Dwell<4 and Dwell>4, higher in VI30.
Note.  Figure 15 provides data that assesses whether the stimuli used in our probes maintained stimulus control over the patterns of responding observed during training. All data comes from VI 30 VI 30COD probe trials, and replicates measures obtained from training: peck-by-peck switch probabilities after switching into a probe schedule stimulus (top two plots), a moving average of response rates with increasing dwell times at a probe schedule stimulus (lower left plot), and the probability of a switch at short versus long dwell times at a probe schedule stimulus (lower right plot). All error bars indicate standard error. Open circles indicate obtained data for individual birds.

A significant statistical difference was also maintained in response rates as the dwell time increased at each probe stimulus. Though not as pronounced as observed in Figure 11, responding to the VI 30COD probes still shows a significantly higher rate of responding when compared to the VI 30 probes (MANOVA, Pillai’s Trace F(2,11) = 4.99, p = .03).

Finally, Figure 15 also shows that differences were maintained in terms of switch probabilities during short vs. longer dwell times. Birds were less likely to switch out of the VI 30COD as compared to the VI 30 probes at short dwell times (MVI30-COD = .18, SE = .03; MVI30 =.35, SE = .06, t(4.18) < .001). That said, within each VI 30 probe, the observed switch probabilities did not significantly increase as across short and long dwell times.

General Discussion

The results from Experiment 2 are largely consistent with Experiment 1. Each of the following was observed in both experiments:

  1. relatively more extreme preference for the VI 30COD in comparison to the VI 30-s schedule (Figures 3 and 10)
  2. relatively longer dwell times at the VI30COD and its paired VI 60-s schedule (Figures 4 and 11)
  3. relatively low switch probabilities out of the VI30COD, as compared to the VI 30-s schedule, especially early in both dwell times and response runs (Figures 5, 6, 12 and 13)
  4. evidence of bursts of short IRTs after switching into the VI 30COD schedule as compared to the VI 30-s schedule (Figures 7 and 14)

Finally, in Experiment 2 our probe results matched our prediction going into both studies. Namely, during probe sessions birds favored the VI 30COD schedule stimulus over the VI 30-s schedule stimulus by a ratio of just under a 2:1. Notably, this result was only for preference as measured in terms of discrete responses. No preference for either stimulus was observed when measured in terms of relative dwell times.

Figure 15 provides us with some, though not perfect, confidence that the design changes made between Experiment 1 and Experiment 2 allowed our probes to maintain the discriminative control over responding that was established during training. The significantly higher response rates to the VI 30COD schedule that were observed during training were maintained during probe trials. In addition, the peck-by-peck switch probabilities out of the VI 30-s stimulus maintained a rise-and-fall pattern that was qualitatively similar to that which was established during training. Neither of these response patterns were maintained in Experiment 1 between training and probe trials.

Taken together, the data are consistent with the interpretation that one effect of a COD is to shape a switch bout consisting of a chunked number of individual responses. Two alternative explanations, though, will be considered. First, could the results be due to a dual process in which CODs cause longer dwell times via increased switch costs (Gomes-Ng et al., 2018; Shahan & Lattal, 1998, 2000) with these dwell times then brought under stimulus control of the schedule key stimulus (McDevitt & Bell, 2013)? Second, could our probe results be explained by birds associating the probe stimuli with their associated trained local rates of reinforcement?

Switch Costs Do Not Account for Our Data

First, during training, the implementation of a changeover delay (COD) produced longer dwell times at both the VI 30COD schedule and its paired VI 60-s schedule when compared to those obtained at the “control” VI 30 VI 60-s schedule (Figure 4). This does resemble data obtained from concurrent VI VI experiments in which CODs are programmed for both schedules of reinforcement. In such experiments longer dwell times have been observed to correlate with longer CODs (Shahan & Lattal, 1998, 2000; Williams & Bell, 1999). One explanation for this finding is that longer dwell times are the result of switch costs imposed by CODs (Gomes-Ng et al., 2018; Shahan & Lattal, 1998, 2000). This account of the relationship between dwell times and CODs asserts that in choosing whether to emit a stay or a switch response, the COD in essence forces a subject to temporally discount the potential reinforcement outcomes that are available via a switch, relative to the fixed reinforcement probability associated with stay responses.

In our experiment, however, we only programmed a COD for one of our concurrent schedules. Yes, we observed longer dwell times to the VI 60-s schedule that was paired with the VI 30COD schedule (Figures 4 and 11). However, we also observed even more significant differences in dwell times between our VI 30COD and VI 30-s schedules. Each of these schedules was paired with equivalent VI 60-s schedules without programmed CODs. Therefore, the switch costs into these two VI 60-s schedules should have been identical, leading to no predicted differences in dwell times at the VI 30COD and VI 30-s schedules. Robust differences, however, were observed. Further, these differences were observed when unique switch keys were utilized (Experiment 1) or a generic switch key was utilized (Experiment 2), making it unlikely that subjects were generalizing switch “costs” between the VI 30COD and VI 60-s schedule.

In addition, the data in Figures 5 and 12 also argue against the hypothesis that CODs impose a switch cost that is defined in terms of temporal discounting. The data in these figures show that switch probabilities from the VI 60-s schedule to the VI 30COD schedule are statistically similar at short (< 4 s) and long (> 4 s) dwell times. The issue here is that as the dwell time at the VI 60-s schedule increases, the probability of reinforcement at the VI30COD also increases. Yes, this probability could be temporally discounted, but it would nonetheless be increasing. Therefore, we would expect to see an increase in switch probabilities from the VI 60-s schedule into the VI30COD schedule with longer dwell times. Instead, no difference was observed between the variable whether switching into the VI 30COD or the VI 30 schedule.

Given the range of studies claiming to support that dwell times are due to switching costs, we are not claiming that this hypothesized mechanism is incorrect. Rather, we suggest our data support the rather more complicated explanation that CODs impact both switch costs and the formation of response chunks. The longer dwell times that we observed in both experiments in the VI 60-s schedule that was paired with the VI 30COD schedule likely results from an expected switch cost that is greater than for the VI 60-s paired with the VI 30 schedule. However, we feel that the cost is more akin to the expected effort of a switch bout (i.e., akin to the post-reinforcement pause of an FR schedule), rather than the temporal delay of reinforcement. Secondly, given the longer dwell times also observed at the VI 30COD relative to the VI 30 schedule, we suggest that switch costs simply cannot account for this finding, and that the results are more likely due to the presence of a response chunk in the VI 30COD schedule that is not present in the VI 30-s schedule.

Local Reinforcement Rates & Probe Outcomes

A strong prediction we made at the outset of our experiments was that, all else being equal, birds will show a preference for a stimulus that had been paired with a COD (see Figure 1). We found such a result in Experiment 2 probe results. However, we found an inverse preference in our Experiment 1 probe results. Our data suggest that in Experiment 1 we failed to maintain stimulus control over trained response structure and that such control was better maintained in Experiment 2. Experiment 2, then, supports our hypothesis that CODs can alter the functional response unit which in turn can then impact measures of peck-based preference. What, though, accounts for the strong avoidance of the COD probe stimulus in Experiment 1? One possibility is local rates of reinforcement.

As noted in the Introduction, Williams and Bell (1999) also ran a set of experiments that utilized multiple concurrent VI VI experiments with CODs (on both concurrent schedules, however). They found, as we did, that longer CODs reliably produced longer runs of responses on a single key. Their preference results from probe pairings of stimuli, though, remained tied to relative reinforcement rates at the concurrent VI VI schedules. Therefore, we tested whether our own probe results from Experiment 1 and 2 might be accounted for by reference to trained local rates of reinforcement.

To compare these alternatives, we conducted simple heuristic simulations of 1000 responses using a first-order Markov chain (Figure 16). These simulations were not intended as a full process model of choice, nor were their parameters fit to the probe data. Rather, they were used as illustrative comparisons of the qualitative predictions generated by three possible sources of control measured during training. First, we measured the relative reinforcements per second obtained by the VI 30COD and VI 30-s schedules, Local Rate (s). Second, we measured the relative reinforcements per response obtained by the VI 30COD and VI 30-s schedules, Local Rate (r). Third, for a response-structure account, we used the relative dwell-time proportions from training to generate switch probabilities and then imposed a switch-bout assumption when the simulated bird entered the VI 30COD state. The “Chunk-4” value was selected as a representative approximation rather than a fitted parameter: it corresponds to the idea that entry into the VI 30COD state included a short run of several schedule-key responses. The qualitative conclusion does not depend on four responses specifically; simulations using three- or five-response chunks produced the same directional pattern, although the magnitude of the predicted peck preference changed with assumed chunk length. Thus, the Chunk-4 simulation should be interpreted as a conservative illustrative case rather than as an estimate of the exact number of responses in a switch bout.

Table 1 provides a summary of the measurements for each subject obtained during training in both Experiments 1 and 2 in terms of relative proportions of local rates of reinforcement and dwell times. The results of the simulations are also provided in terms of relative preference for the VI 30-s stimulus over the VI 30COD stimulus.

Table 1
Simulations of Probe Data Using Local Reinforcement Rates and Switch Bouts

Experiment 2


Experiment 1


Local Rate


Local Rate


VI 30

reinf / s


reinf / resp


Dwell


VI 30

reinf / s


reinf / resp


Dwell


B1

0.04

0.08

0.58


B1

0.10

0.10

0.60


B2

0.04

0.07

0.61


B2

0.05

0.06

0.67


B3

0.04

0.07

0.63


B3

0.05

0.07

0.67


B4

0.04

0.08

0.55


B4

0.08

0.09

0.61


B5

0.04

0.06

0.65


B5

0.05

0.07

0.66


B6

0.04

0.07

0.62


B7

0.09

0.10

0.58


B7

0.04

0.05

0.59


B8

0.05

0.07

0.60


Average

0.04

0.07

0.60


Average

0.07

0.08

0.63


VI 30-COD


VI 30-COD


B1

0.03

0.05

0.71


B1

0.03

0.04

0.75


B2

0.05

0.05

0.49


B2

0.04

0.04

0.59


B3

0.04

0.04

0.59


B3

0.05

0.04

0.49


B4

0.03

0.05

0.67


B4

0.04

0.04

0.71


B5

0.04

0.04

0.68


B5

0.04

0.03

0.68


B6

0.04

0.05

0.55


B7

0.04

0.04

0.67


B7

0.04

0.03

0.56


B8

0.04

0.04

0.65


Average

0.04

0.04

0.60


Average

0.04

0.04

0.65


Probe Predictions (for VI 30 stimulus)


Probe Predictions (for VI 30 stimulus)


Local Rate (s)

Local Rate (r)

Chunk-4


Local Rate (s)

Local Rate (r)

Chunk-4


B1

0.56

0.63

0.26


B1

0.75

0.72

0.27


B2

0.47

0.60

0.36


B2

0.55

0.64

0.33


B3

0.46

0.62

0.33


B3

0.50

0.63

0.31


B4

0.54

0.61

0.26


B4

0.70

0.68

0.25


B5

0.52

0.63

0.32


B5

0.55

0.68

0.33


B6

0.52

0.61

0.34


B7

0.70

0.71

0.32


B7

0.54

0.63

0.32


B8

0.56

0.61

0.32


Average

0.51


0.62


0.31


Average

0.63


0.67


0.31

Figure 16
Simulations of Probe Results

Simulations of Probe Results
Note. Simulations of probe results were conducted using a 1st-order Markov chain in which the two states were defined by pecks to the VI 30COD and VI 30 probe stimuli. a and b are stay probabilities for each stimulus. These were determined by taking the ratios of the local rates of reinforcement or the ratios of the average switch probabilities from training. Local rates were measured both in terms of reinforcement per second (s) and reinforcement per response (r). Chunk-4 probabilities were obtained from the average dwell proportions at each schedule obtained during training. Note that the Chunk-4 simulation is intended as a heuristic response-structure comparison rather than a fitted model; chunk lengths of three or five responses produced the same qualitative direction of prediction, with larger assumed chunks producing stronger peck-based preference for the VI 30COD stimulus. The top graph provides simulations for Experiment 1, while the bottom graph provides simulations for Experiment 2. Error bars indicate standard deviations.

Our simulations for Experiment 1 do indeed suggest that the local rates of reinforcement experienced at the VI 30COD and VI 30 stimuli during training, might carry over to explain probe preferences. On average these local reinforcement rates were higher at the stimulus paired with the VI 30-s schedule, and during probes, we see a concomitant preference for this stimulus over that paired with the VI 30COD. However, in Experiment 2, despite an almost identical methodology, we see that local rates of reinforcement do not provide a strong prediction for our probe results. In this case, the heuristic Chunk-4 simulation captures the direction of the probe result better than the local-rate simulations, although this should not be interpreted as a fitted model of the underlying behavioral process. How might we explain these opposing results?

Unfortunately for parsimony, the best explanation seems to be that birds learn multiple associations to stimuli during training. Local rates of reinforcement are a molar variable, while switch bouts are a molecular variable. It seems reasonable to assume that stimulus associations with these two variables can be independently established and disrupted.

Our hypothesis to explain our probe results, then, is that both Experiment 1 and Experiment 2 established switch bouts that were associated with the VI 30COD stimulus but not the VI 30 stimulus. Simultaneously, these stimuli also established associations with the trained local rates of reinforcement. In Experiment 1 we lost stimulus control over molecular choice structure during our probe tests, leaving only associations local reinforcement rates to control choice. In Experiment 2, though, stimulus control over molecular choice structure was somewhat maintained, leaving it to control probe preference.

Boundary Conditions and Response Units

The present results suggest an important boundary condition for interpreting response chunks in concurrent VI VI schedules. Our claim is not that a COD produces a generalized motor pattern that transfers independently of context. Rather, the present data suggest that the response chunk produced by a COD is part of an operant that is occasioned by a discriminative stimulus. That is, the outcome is part of the classic SD(R-O) conceptualization of an operant unit. In this conceptualization, a stimulus serves to inform the organism when a particular response-outcome contingency is active. During training in both experiments, the VI 30COD schedule generated a distinctive pattern of responding: longer dwell times, higher initial response rates, lower early switch probabilities, and bursts of short IRTs that were not observed to the same degree at the VI 30-s schedule without a COD. These effects are consistent with the interpretation that the COD did not simply reduce switching, but helped organize the transition into the VI 30COD schedule into a functional response unit: a switch bout. However, the mixed probe results show that the expression of this unit depends on whether the probe trials preserved the discriminative control established during training.

This distinction is important for evaluating the results of Experiment 1. In that experiment, the probe test did not produce the predicted preference for the VI 30COD stimulus. Instead, preference favored the VI 30-s stimulus. We hypothesized that this result was due to the fact that the probe procedure failed to maintain the stimulus control necessary for the trained switch bout to be expressed. This interpretation weakens a simple version of the chunking account, in which a switch bout would be expected to transfer broadly whenever the VI 30COD stimulus is presented. However, it is consistent with a more constrained version of the account: response chunks are learned behavioral units whose expression depends on the stimulus and response context in which the relevant unit was trained. So, for example, a “true” discriminative stimulus in Experiment 1 might consist of a compound stimulus of both the VI 60 schedule-key stimulus and a VI 30COD switch-key stimulus. From this view, the probe test in Experiment 1 did not simply ask whether birds preferred one schedule stimulus over another. It also altered the conditions under which the trained switch unit would normally be occasioned.

Experiment 2 provides a stronger test of this more constrained hypothesis. By using a common switch key, Experiment 2 reduced the discrepancy between the training and probe contexts. Under these conditions, the probe results were more consistent with the chunking prediction: birds showed a response-based preference for the VI 30COD stimulus, while dwell-time preference remained near indifference. This pattern is important because the chunking account specifically predicts a dissociation between discrete pecks and dwell time. If a switch into the VI 30COD schedule includes multiple pecks that function as part of a single extended switch unit, then a preference measured in discrete responses may overestimate the value of that alternative relative to a measure based on time allocation. Thus, the stronger preference for the VI 30COD stimulus in terms of pecks is not taken as evidence that the VI 30COD schedule had greater assumed value. Instead, the claim is that the response measure itself may be inflated when the measured responses include multiple components of a single functional unit.

This interpretation also clarifies what is, and is not, unique to the chunking account. Standard reinforcement-rate or matching-based accounts predict that preference should track obtained reinforcement rates, including local rates of reinforcement associated with the schedule stimuli. Such accounts can explain some aspects of the data. In particular, the Experiment 1 probe reversal is consistent with the possibility that birds responded according to the local reinforcement rates experienced during training, rather than according to the response structure established by the COD. The simulations presented above support this possibility. Thus, the present experiments should not be taken as showing that local reinforcement rates are irrelevant. They clearly remain a plausible and important determinant of probe preference.

The chunking account makes a narrower and more specific prediction. It predicts that, when the probe context maintains the discriminative conditions required for the trained response structure to be expressed, preference measured in discrete pecks should diverge from preference measured in dwell time, and this divergence should favor the COD-associated stimulus. It also predicts that this divergence should be accompanied by molecular evidence of a distinctive response unit: elevated initial response rates, reduced early switching, and a delayed emergence of longer IRTs after entry into the COD-associated schedule. These molecular predictions are not straightforward consequences of a simple matching account based only on overall obtained reinforcement rates. The evidence for the chunking account is therefore strongest not in the probe preference measure alone, but in the convergence between the molecular response patterns observed during training and the response-based probe preference observed when stimulus control was better preserved.

The present results also suggest the need for a more formal definition of the switch bout. Descriptively, we have used the term to refer to a burst of responses after a switch into the VI 30COD schedule. More formally, a switch bout can be defined as a sequence of schedule-key responses following a switch response in which the probability of continued responding remains high and IRTs remain short, followed by a transition point marked by an increased probability of either a longer IRT or a switch away from the schedule. In the present experiments, this transition was estimated by examining peck-by-peck switch probabilities and the probability of IRTs exceeding selected thresholds. The clearest evidence for a bout boundary was the delayed appearance of longer IRTs at the VI 30COD schedule relative to the VI 30-s schedule. Future work should specify this boundary a priori, for example by defining a bout as ending at the first IRT exceeding a criterion threshold, or by fitting a mixture or hazard model that estimates within-bout and between-bout response states. Such a definition would allow switch bouts to be incorporated more directly into formal models of choice.

This point also clarifies how the present hypothesis extends prior work on CODs. Previous accounts have shown that CODs increase dwell times, reduce switching, alter local reinforcement probabilities, and can bring extended visits under stimulus control. The present contribution is to propose that these effects may operate not only by changing the value or cost of switching, but also by changing the response unit to which reinforcement is assigned. Under this account, a COD may transform a switch from a single discrete response into a temporally extended unit consisting of several pecks. Once that occurs, a measured increase in discrete pecking need not imply a corresponding increase in the value of the COD-associated alternative. Instead, it may reflect a change in the structure of the behavior being measured.

Data Availability Statement

The data needed to reproduce the presented results have been published at Cleaveland (2026).  

Conflicts of Interest

The author declares no competing interests.  

Editor Curated

Frequently Asked Questions

  • What is a 'switch bout' and why does it matter?

    A switch bout is a proposed response chunk: instead of a single peck to move to a new option, an animal produces a short, cohesive run of rapid pecks that functions as one unit. According to Cleaveland (2026), a changeover delay can transform a switch from a single discrete event into this extended chunk. This matters because standard preference measures count every peck separately. If one option triggers multi-peck switch bouts, a researcher might record a 2:1 peck ‘preference’ that does not reflect greater value at all — it simply reflects more pecks packed into a single functional response unit, which could mislead models of choice behavior.

  • How did the researcher design the experiments?

    Cleaveland (2026) trained pigeons on multiple concurrent variable-interval schedules using a Findley procedure, where pecks to a side ‘switch key’ changed the active schedule at a central ‘schedule key.’ Two identical VI 30-s VI 60-s pairs were used, but only one VI 30-s schedule carried a 2.5-second changeover delay (VI 30COD). The design included:

    1. Autoshaping and alternation pre-training;
    2. Thirty sessions of concurrent VI VI training;
    3. Unreinforced probe trials pairing the two VI 30-s stimuli.

    Experiment 1 used a three-key procedure with distinct switch keys, while Experiment 2 used a traditional two-key Findley procedure with a common white switch key to better preserve stimulus control during probes.

  • What is a changeover delay and why is it not a 'neutral' tool?

    A changeover delay (COD) is a brief period after switching to a new option during which responses cannot earn reinforcement. It was originally introduced to reduce accidental reinforcement of rapid switching. However, Cleaveland (2026) emphasizes that CODs actively reshape behavior rather than simply filtering it. The study shows CODs lengthen dwell times, reduce early switching, and organize responding into bursts of short interresponse times. Prior work cited in the paper (Williams & Bell, 1999; McDevitt & Bell, 2013; Gomes-Ng et al., 2018) similarly found CODs extend stays and can create biases independent of reinforcement rate, supporting the idea that the COD is a powerful methodological force, not a passive control procedure.

  • Did the peck-based preference reflect that the COD schedule was actually more valuable?

    No. Cleaveland (2026) found that the stronger peck-based preference for the VI 30COD schedule was not matched by a dwell-time preference. In Experiment 1, preference measured by dwell time showed no statistically significant difference between the two VI 30-s schedules (M = .65 vs. .63, t(6) = .55, p = .59). This dissociation is the key point: the extra recorded pecks came from the structure of the switch bout, not from the schedule being intrinsically preferred. Paradoxically, the COD also lengthened dwell times at the paired VI 60-s schedule, which offset the relative dwell-time measure and reinforced the interpretation that pecks and value are not the same thing.

  • Why did the two experiments produce different probe results?

    The probe tests were designed to see whether the trained switch bout would carry over when the two VI 30-s stimuli were paired. In Experiment 1, birds unexpectedly favored the plain VI 30 stimulus about 2:1, and analyses suggested stimulus control over the switch bout was lost. Cleaveland (2026) suspected this happened because the three-key design created a novel stimulus environment during probes. Experiment 2 therefore used a traditional two-key Findley procedure with a common switch key, so the stimulus environment stayed identical between training and probes. Under this design, birds showed the predicted response-based preference for the VI 30COD stimulus (M = .62), though no statistically significant dwell-time preference emerged (M = .53).

References

Balleine, B. W., & Dickinson, A. (1998). Goal-directed instrumental action: Contingency and incentive learning and their cortical substrates. Neuropharmacology, 37(4-5), 407–419. https://doi.org/10.1016/S0028-3908(98)00033-1

Balleine, B. W., & O’Doherty, J. P. (2010). Human and rodent homologies in action control: Corticostriatal determinants of goal-directed and habitual action. Neuropsychopharmacology, 35(1), 48–69. https://doi.org/10.1038/npp.2009.131

Barnes, T. D., Kubota, Y., Hu, D., Jin, D. Z., & Graybiel, A. M. (2005). Activity of striatal neurons reflects dynamic encoding and recoding of procedural memories. Nature, 437(7062), 1158–1161. https://doi.org/10.1038/nature04053

Baum, W. M. (1974). On two types of deviation from the matching law: Bias and undermatching. Journal of the Experimental Analysis of Behavior, 22(1), 231–242. https://doi.org/10.1901/jeab.1974.22-231

Brown, K.B., & Cleaveland, J. M. (2009). An application of the active time model to multiple concurrent variable-interval schedules. Behavioral Processes, 81, 250–255. https://doi.org/10.1016/j.beproc.2008.10.014

Cleaveland, J. M. (2024). The active time model of concurrent choice. PLOS ONE, 19(5), e0301173. https://doi.org/10.1371/journal.pone.0301173

Cleaveland, J. (2026). Data set for “When a stay is a switch: Discriminative control of response chunks determines preference during concurrent VI VI schedules” [Dataset]. PsychArchives. https://doi.org/10.23668/psycharchives.21546

Findley, J. D. (1958). Preference and switching under concurrent scheduling. Journal of the Experimental Analysis of Behavior, 1(2), 123–144. https://doi.org/10.1901/jeab.1958.1-123

Fujii, N., & Graybiel, A. M. (2003). Representation of action sequence boundaries by macaque prefrontal cortical neurons. Science, 301(5637), 1246–1249. https://doi.org/10.1126/science.1086872

Gibbon, J. (1995). Dynamics of time matching: Arousal makes better seem worse. Psychonomic Bulletin & Review, 2(2), 208–215. https://doi.org/10.3758/BF03210960

Gomes-Ng, S., Landon, J., Elliffe, D., Bensemann, J., & Cowie, S. (2018). The effects of changeover delays on local choice. Behavioural Processes, 150, 36–46. https://doi.org/10.1016/j.beproc.2018.02.019

Graybiel, A. M. (1998). The basal ganglia and chunking of action repertories. Neurobiology of Learning and Memory, 70(1-2), 119–136. https://doi.org/10.1006/nlme.1998.3843

Graybiel, A. M. (2008). Habits, rituals, and the evaluative brain. Annual Review of Neuroscience, 31, 359–387. https://doi.org/10.1146/annurev.neuro.29.051605.112851

Herrnstein, R. J. (1961). Relative and absolute strength of response as a function of frequency of reinforcement. Journal of the Experimental Analysis of Behavior, 4(3), 267–272. https://doi.org/10.1901/jeab.1961.4-267

Hinson, J. M., & Staddon, J. E. R. (1983a). Hill-climbing by pigeons. Journal of the Experimental Analysis of Behavior, 39(1), 25–47. https://doi.org/10.1901/jeab.1983.39-25

Hinson, J. M., & Staddon, J. E. R. (1983b). Matching, maximizing, and hill-climbing. Journal of the Experimental Analysis of Behavior, 40(3), 321–331. https://doi.org/10.1901/jeab.1983.40-321

Houston, A. I., McNamara, J. M., & Webb, J. N. (1995). The evolutionarily stable exploitation of a renewing resource. Journal of Theoretical Biology, 177(2), 151–158. https://doi.org/10.1006/jtbi.1995.0233

Jog, M. S., Kubota, Y., Connolly, C. I., Hillegaart, V., & Graybiel, A. M. (1999). Building neural representations of habits. Science, 286(5445), 1745–1749. https://doi.org/10.1126/science.286.5445.1745

MacDonall, J. S. (2009). The stay/switch model of concurrent choice. Journal of the Experimental Analysis of Behavior, 91(1), 21–39. https://doi.org/10.1901/jeab.2009.91-21

McDevitt, M. A., & Bell, C. (2013). Effects of changeover delay on response allocation during probe tests. Journal of the Experimental Analysis of Behavior, 100(2), 135–146. https://doi.org/10.1002/jeab.44

McKenzie, A.T., & Cleaveland, J.M. (2010). A further application of the active time model to multiple concurrent variable-interval schedules. Behavioral Processes, 84, 470–475. https://doi.org/10.1016/j.beproc.2009.09.006

O’Doherty, J. P., Dayan, P., Schultz, J., Deichmann, R., Friston, K., & Dolan, R. J. (2004). Dissociable roles of ventral and dorsal striatum in instrumental conditioning. Science, 304(5669), 452–454. https://doi.org/10.1126/science.1094285

Schwartz, B. (1980). Development of complex, stereotyped behavior in pigeons. Journal of the Experimental Analysis of Behavior, 33(2), 153–166. https://doi.org/10.1901/jeab.1980.33-153

Schwartz, B. (1982). Interval and ratio reinforcement of a complex sequential operant in pigeons. Journal of the Experimental Analysis of Behavior, 37(3), 349–357. https://doi.org/10.1901/jeab.1982.37-349

Shahan, T. A., & Lattal, K. A. (1998). On the functions of the changeover delay. Journal of the Experimental Analysis of Behavior, 69(2), 141–160. https://doi.org/10.1901/jeab.1998.69-141

Shahan, T. A., & Lattal, K. A. (2000). Choice, changing over, and reinforcement delays. Journal of the Experimental Analysis of Behavior, 74(3), 311–330. https://doi.org/10.1901/jeab.2000.74-311

Shull, R. L., Grimes, J. A., & Bennett, J. A. (2004). Bouts of responding: The relation between bout rate and the rate of variable-interval reinforcement. Journal of the Experimental Analysis of Behavior, 81(1), 65–83. https://doi.org/10.1901/jeab.2004.81-65

Silberberg, A., Hamilton, B., Ziriax, J. M., & Casey, J. (1978). The structure of choice. Journal of Experimental Psychology: Animal Behavior Processes, 4(4), 368–398. https://doi.org/10.1037/0097-7403.4.4.368

Smith, T. T., McLean, A. P., Shull, R. L., Hughes, C. E., & Pitts, R. C. (2014). Concurrent performance as bouts of behavior. Journal of the Experimental Analysis of Behavior, 102(1), 102–125. https://doi.org/10.1002/jeab.90

Terrace, H. S. (1991a). Chunking during serial learning by a pigeon: I. Basic evidence. Journal of Experimental Psychology: Animal Behavior Processes, 17(1), 81–93. https://doi.org/10.1037/0097-7403.17.1.81

Terrace, H. S. (1991b). Chunking during serial learning by a pigeon: III. What are the necessary conditions for establishing a chunk? Journal of Experimental Psychology: Animal Behavior Processes, 17(1), 107–118. https://doi.org/10.1037/0097-7403.17.1.107

Terrace, H. S., & Chen, S. (1991). Chunking during serial learning by a pigeon: II. Integrity of a chunk on a new list. Journal of Experimental Psychology: Animal Behavior Processes, 17(1), 94–106. https://doi.org/10.1037/0097-7403.17.1.94

Williams, B. A., & Bell, M. C. (1999). Preference after training with differential changeover delays. Journal of the Experimental Analysis of Behavior, 71(1), 45–55. https://doi.org/10.1901/jeab.1999.71-45

Previous Post
A photo showing a dim, cluttered teenager's bedroom viewed at dusk, with a large window revealing a burning, apocalyptic cityscape glowing orange through partially raised blinds and curtains. Inside are an unmade bed, a wooden chair, a glowing computer monitor on a messy desk, scattered cables, and photographs taped to the walls—visually evoking youth isolation, dystopian worldviews, and radicalization themes discussed in the article.

Shifts and continuity in contemporary violent extremism: Moving toward a dynamic and developmental understanding?