


In recent years, psychological science has witnessed a significant paradigm shift in how it conceptualizes and studies psychological constructs. Moving beyond traditional latent variable models, which posit that observable indicators like symptoms or behaviors are caused by an underlying, unobserved entity, the network perspective offers a fundamentally different approach. This framework conceptualizes psychological constructs such as depression, anxiety, or personality not as monolithic latent variables, but as complex, dynamic systems of interacting components. From this viewpoint, a disorder like depression is the system of mutually reinforcing symptoms—sad mood, insomnia, fatigue, and concentration problems—that influence one another over time. The core premise is that understanding the structure and dynamics of these relationships is the key to understanding the construct itself.
The field of network psychometrics has now progressed beyond its initial, primarily exploratory phase into a more mature and critical stage of development. This evolution is marked by a rigorous focus on methodological robustness, the creation of sophisticated models capable of capturing dynamic and context-dependent processes, and the development of practical, user-friendly tools to make these advanced methods accessible to a broader research community. This maturation reflects a growing awareness that the power of network models is matched by their sensitivity to data quality, analytical choices, and underlying statistical assumptions. The current frontier is defined by a push to build models that are not only statistically sound but also psychologically meaningful and practically applicable.
This knowledge hub provides a comprehensive overview of this evolving landscape. It synthesizes key findings from recent peer-reviewed research to offer an evidence-based guide for students, researchers, and practitioners. The following sections are organized thematically to navigate the field’s most pressing topics. First, we address foundational methodological challenges that researchers must consider to ensure the validity and robustness of their network models. Next, we explore cutting-edge innovations in dynamic modeling that allow for the analysis of change, context, and individual-level processes. We then provide a practical guide to the increasingly central role of Bayesian estimation in network analysis. Finally, we conclude by showcasing how these advanced models are being applied to bridge the gap between abstract statistical structures and meaningful psychological phenomena, offering actionable insights for both theory and practice.
Key Takeaways
- Methodological Robustness is Paramount: The structure and interpretation of psychological networks are highly sensitive to methodological artifacts. Issues such as omitted variables, measurement error, and the improper handling of longitudinal data can create spurious connections or mask true relationships, fundamentally altering the conclusions drawn from a model (Haslbeck & Epskamp, 2024; Henry & Ye, 2024).
- Modeling Dynamics and Change is the New Frontier: The field is rapidly advancing beyond static, cross-sectional snapshots of psychological systems. The focus has shifted to dynamic, person-specific (idiographic) models that capture how these systems change over time and in response to different contexts, such as interventions or life events (Bringmann et al., 2024; Wysocki et al., 2025; Yang et al., 2024).
- Bayesian Methods Offer Powerful Tools for Uncertainty Quantification: The Bayesian paradigm is becoming increasingly central to network psychometrics. It provides a robust and flexible framework for managing the inherent uncertainty in network estimation, incorporating prior knowledge, and developing versatile models that can handle diverse data types (Franco et al., 2024; Huth et al., 2024; Sekulovski et al., 2024).
- From Structure to Meaning: Bridging Theory and Application: Novel methods are emerging that connect abstract network structures to tangible psychological phenomena. These innovations allow researchers to link networks to the semantic content of psychometric items, predict external outcomes, and analyze complex real-world behaviors like the emotional dynamics of political discourse (Johal & Rhemtulla, 2024; Stanghellini et al., 2024; Tomašević & Major, 2024).
Foundational Challenges in Network Estimation: Ensuring Robustness and Validity
As network psychometrics matures, the field is engaging in critical self-reflection regarding the robustness and validity of its models. The visual appeal and intuitive nature of network graphs can sometimes mask underlying statistical complexities and vulnerabilities. This section addresses three foundational challenges that researchers must navigate to ensure their models provide an accurate and meaningful representation of psychological reality: the distorting effects of omitted variables and measurement error, the critical distinction between within-person and between-person processes in longitudinal data, and the careful line between statistical association and causal inference.
How Do Omitted Variables and Measurement Error Distort Network Structures?
Network models, particularly the cross-sectional Gaussian Graphical Models (GGMs) that are widely used, are not immune to classic statistical problems that can threaten the validity of any multivariate analysis. Research by Henry and Ye (2024) provides a systematic investigation into the consequences of two such problems: omitted variable bias and measurement error. Their findings underscore that the estimated structure of a psychological network can be significantly distorted if these issues are not addressed.
The omission of important variables from a model—for instance, failing to measure a key symptom that influences several others—can lead to two types of errors. It can create spurious edges, or false positive connections, between nodes that are not directly related but share a common cause (see Figure 1). Conversely, it can also lead to the suppression of true edges, or false negatives, masking a genuine direct relationship. Measurement error, which refers to the unreliability of the instruments used to measure the nodes, tends to have a different but equally problematic effect: it systematically inflates edge weights and overall network density. This makes the psychological construct appear more interconnected and resilient than it actually is, potentially leading to incorrect conclusions about the system’s dynamics.
A critical finding from this research is that simply collecting more data is not a solution to these problems. The simulation study demonstrated that the negative impacts of both omitted variables and measurement error were of a similar magnitude for large sample sizes as they were for smaller ones (Henry & Ye, 2024). This challenges any “big data” ethos suggesting that quantity can compensate for quality. The clear implication is that the primary focus for researchers should be on improving the theoretical grounding and psychometric quality of their measurements before applying network models. In a direct comparison of two common estimation methods, EBICglasso and LoGo-TMFG, the study found that EBICglasso tended to be more robust to these issues, particularly in smaller networks. This provides practical guidance for researchers when selecting an estimation algorithm.
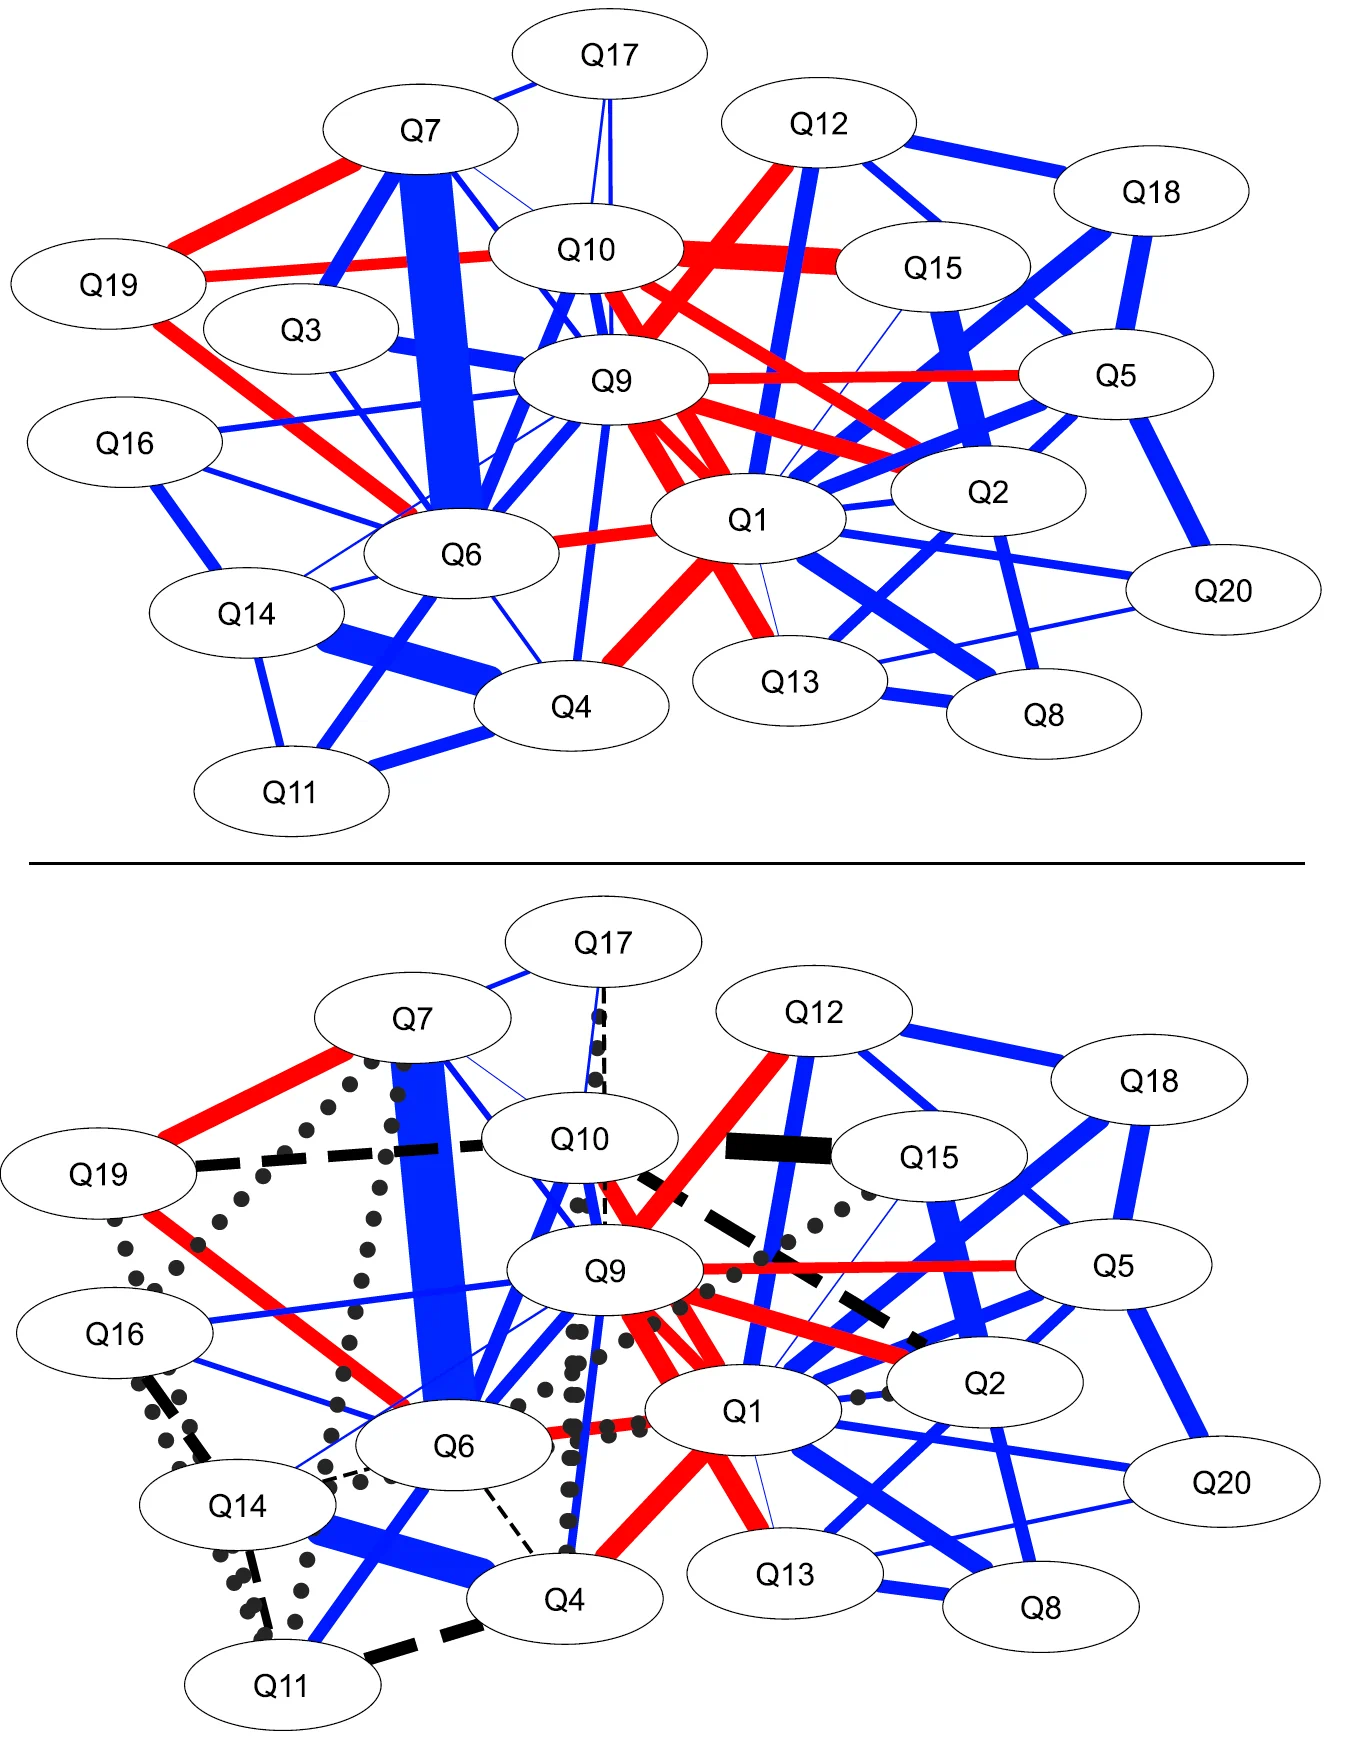
Figure 1
Psychometric Network of MACH-IV Scale in Henry and Ye (2024). Top Panel: Full Scale. Bottom Panel: Scale with Q3 removed. Edge thickness represents partial correlation magnitude. Red edges are negative associations, blue edges are positive associations. Dashed black lines are edges that are not detected once Q3 was removed. Dotted black lines represent false positive edges that are estimated only when Q3 was removed.
Why Must We Distinguish Within-Person from Between-Person Effects in Longitudinal Data?
The analysis of intensive longitudinal data, where individuals are measured repeatedly over time, is central to understanding psychological dynamics. However, this type of data has a two-level structure: processes that occur within a person over time (e.g., daily fluctuations in mood and sleep) and stable differences between people (e.g., one person’s average mood being higher than another’s). A subtle but profound statistical bias can arise when these two levels are not properly separated.
A study by Haslbeck and Epskamp (2024) elegantly demonstrates that observed correlations between individuals’ average scores (person-means) are a mathematical function of both the true between-person correlation and the dynamic correlations occurring within each person. This means that a strong within-person relationship—for example, a person’s anxiety on one day strongly predicting their fatigue the next—can artificially inflate, deflate, or even create a spurious correlation between their average levels of anxiety and fatigue (see Figure 2). This bias is most severe when the number of measurement occasions per person is low, between-person variance is small, and within-person effects are strong.
This finding has significant implications for a large body of research that has used simpler, stepwise approaches to analyzing longitudinal data, including methods implemented in popular software packages. Such approaches may have inadvertently conflated dynamic, state-like processes with stable, trait-like relationships, potentially leading to incorrect conclusions. To avoid this analytical pitfall, Haslbeck and Epskamp (2024) strongly recommend that researchers use methods that jointly estimate within- and between-person effects in a single step. Models such as Dynamic Structural Equation Modeling (DSEM) are designed for this purpose, providing a more accurate and unbiased separation of these distinct levels of analysis. This call for a shift in methodological standards underscores the need for the more sophisticated dynamic models discussed later in this hub, as they are explicitly designed to handle such complexities.
Figure 2
Between-person networks estimated with the mlVAR method for between-person standard deviations in means of 0, 0.1, 0.25, and 0.5 on 250 subjects with a time series length of 250 each. Blue edges indicate positive parameters, red edges indicate negative parameters. Solid edges are included at a significance threshold of alpha = 0.05. The data generating (true) between-person network is empty, which means that all shown effects are bias induced by the lagged and contemporaneous within-effects. Figure from Haslbeck and Epskamp (2024).

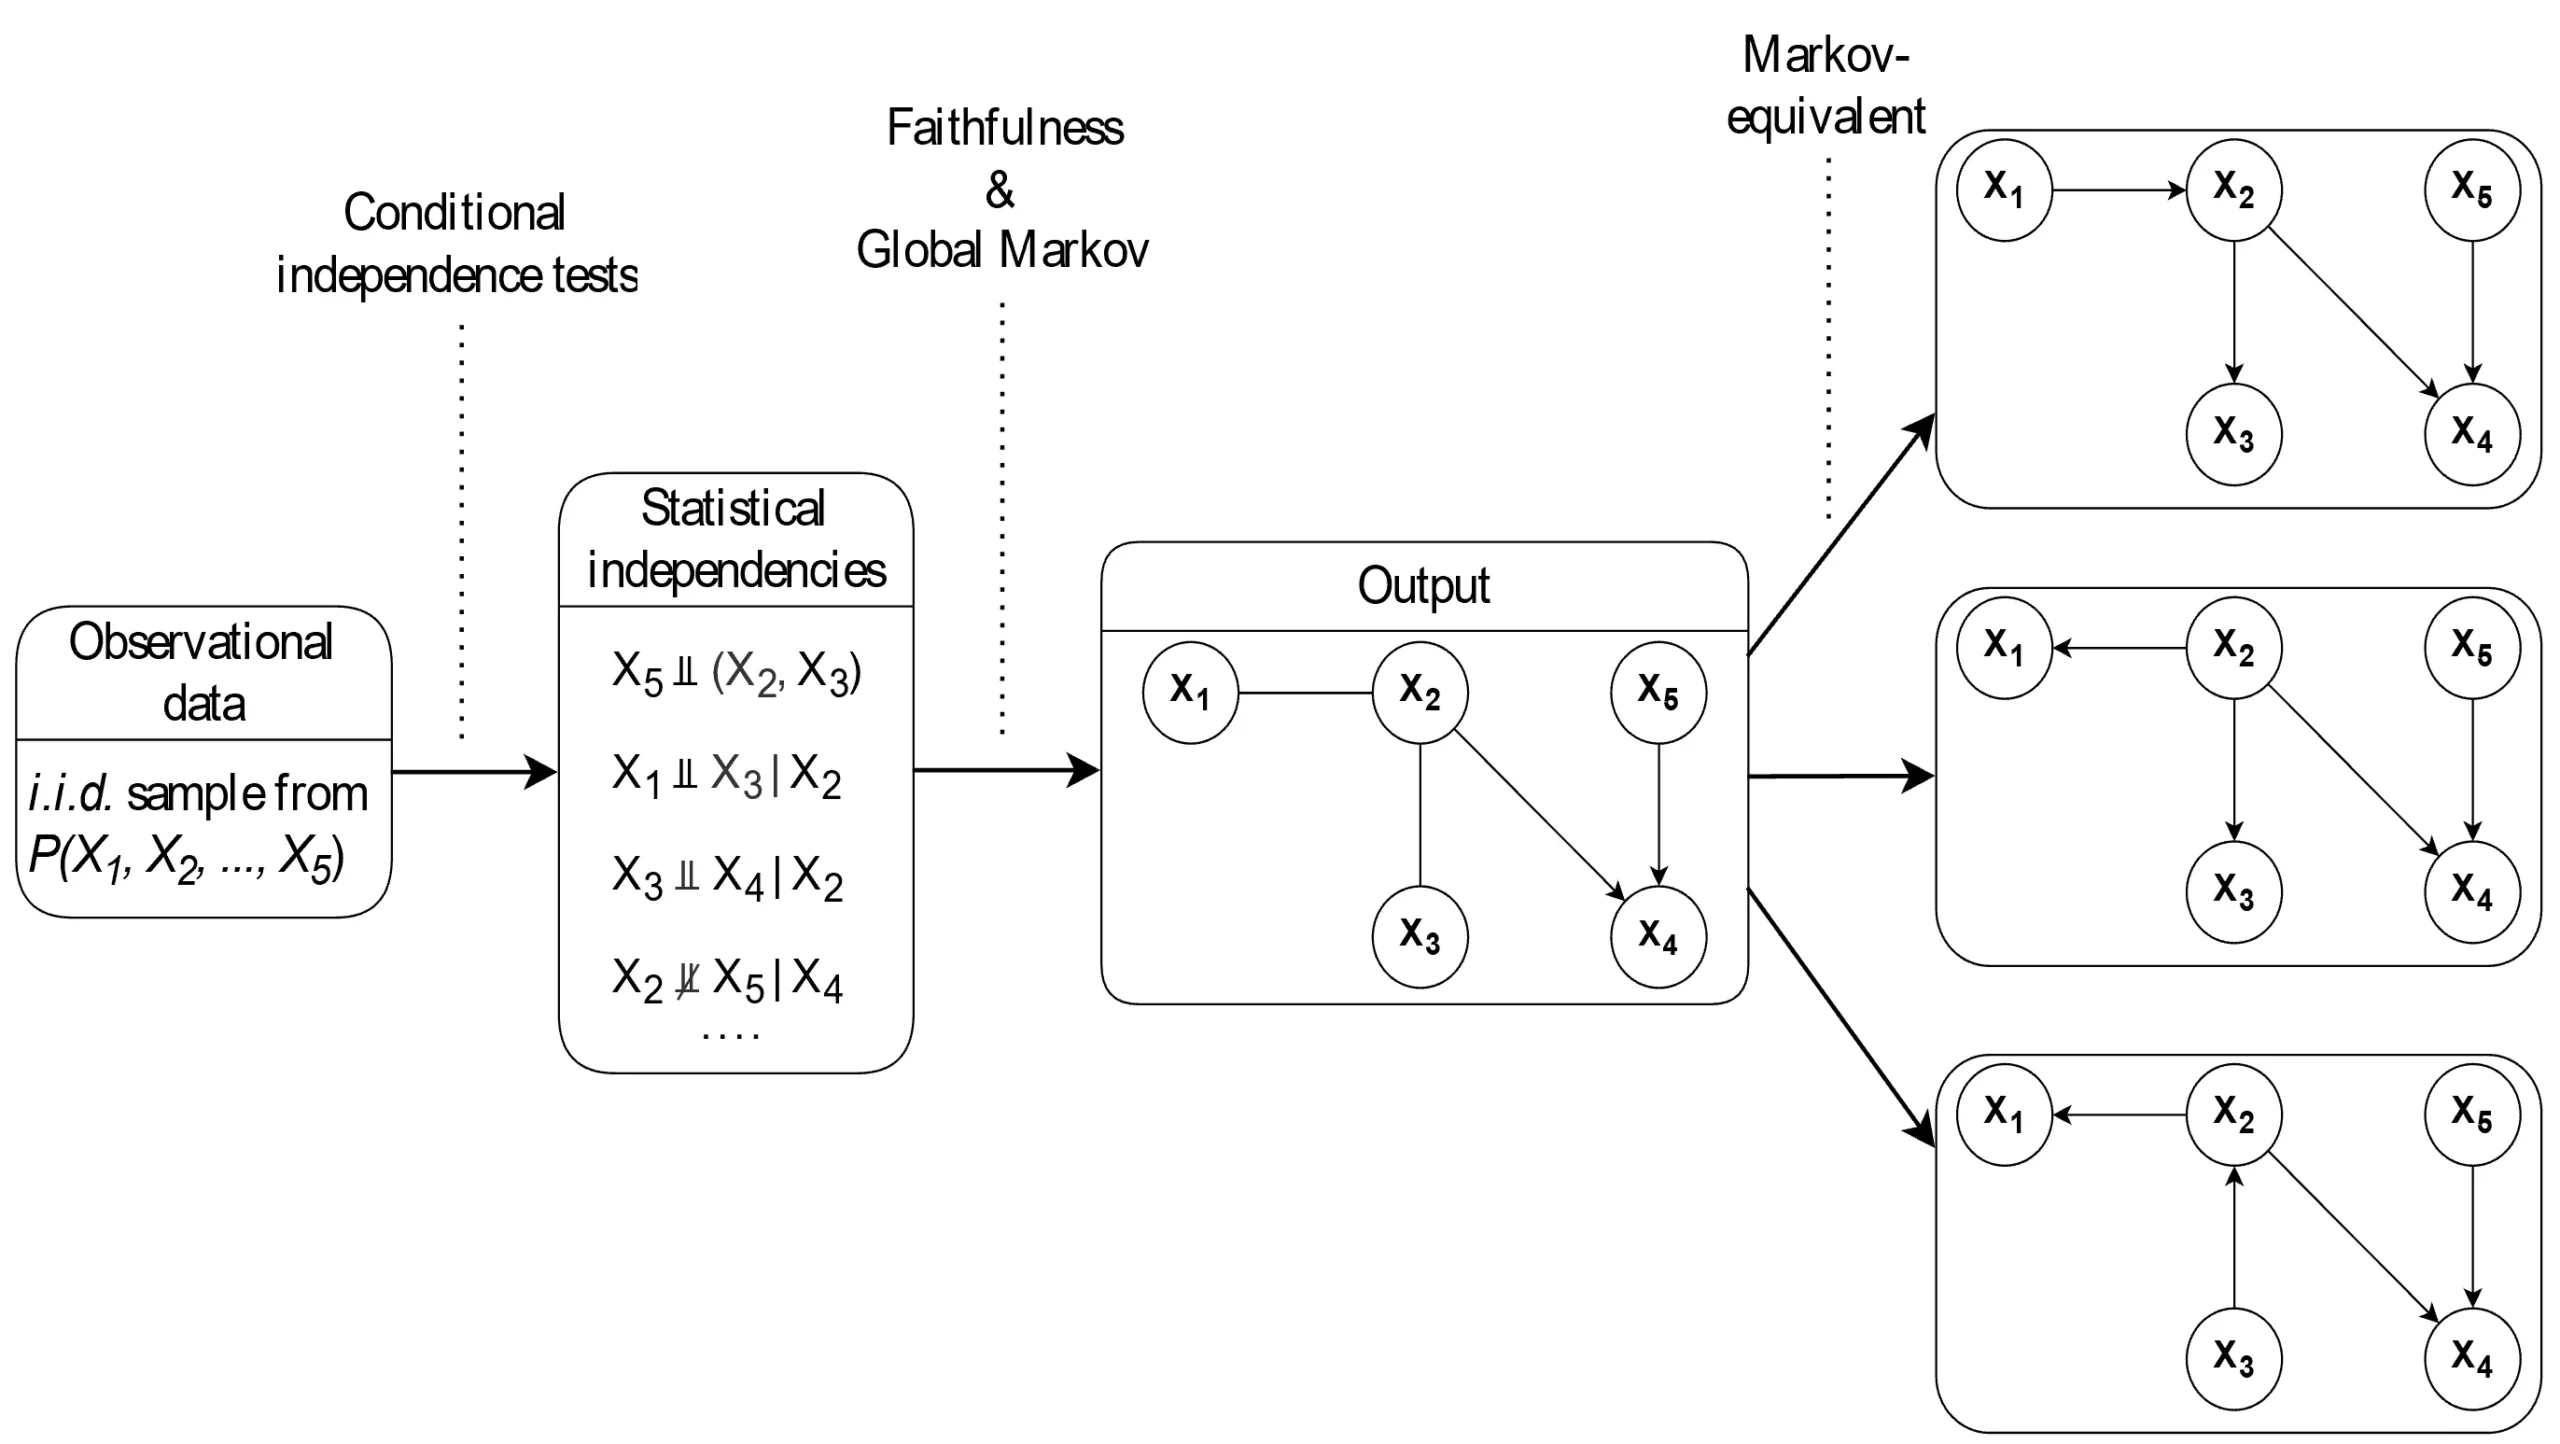
Can Network Models Reveal Causal Relationships?
One of the most appealing aspects of network models is their ability to generate hypotheses about causal relationships—for instance, suggesting that intervening on a “central” symptom could deactivate an entire disorder. However, it is crucial to distinguish between the statistical relationships estimated in standard network models (i.e., partial correlations) and genuine causal effects. Research by Park et al. (2024) argues that the field must exercise greater caution in its causal rhetoric, as standard network models are likely to perform poorly as causal discovery tools.
The primary limitation is that psychological phenomena are often characterized by feedback loops and reciprocal relationships (e.g., insomnia worsens sad mood, which in turn worsens insomnia). Standard network models, which are based on acyclic assumptions, cannot adequately represent these cyclic dynamics. As a result, the estimated network structure may not reflect the underlying causal pathways. An empirical example analyzing depression symptom data demonstrated this clearly: a standard statistical network contained numerous spurious edges when compared to the output of algorithms specifically designed for causal discovery (Park et al., 2024).
Instead of relying on partial correlation networks for causal inference, the authors advocate for the use of constraint-based cyclic causal discovery methods. These algorithms are better suited to exploring the underlying causal structure from purely observational data. A simulation study compared several state-of-the-art methods and found that an autoregressive-based approach, the CCI algorithm, was the most promising for accurately discovering cyclic causal structures from psychologically plausible data, particularly in sparse networks. This research does not diminish the value of standard network models but reframes their role. They are powerful tools for description and hypothesis generation, but for questions of causation, more specialized and purpose-built methods are required. This calls for a paradigm-wide shift in how researchers interpret and communicate their findings, placing a firm boundary on the explanatory power of standard network models.
Figure 3
Summary of the constraint-based causal discovery procedure proposed in Park et al. (2024).
Innovations in Modeling Psychological Dynamics
In response to the limitations of static, cross-sectional models, the field of network psychometrics is rapidly developing innovative methods to capture the rich, dynamic, and context-dependent nature of psychological phenomena. This section highlights four cutting-edge approaches that represent the new frontier of network modeling. These methods allow researchers to map how systems change over time, understand why they change at the individual level, model complex group dynamics, and even connect statistical structures to the semantic meaning of psychological concepts.
How Can We Map Item-Level Changes Over Time with Cross-Lagged Panel Networks?
A common scenario in psychological research involves longitudinal panel data, where multiple variables are measured for a group of individuals at a few distinct time points (e.g., pre-test, post-test, and a six-month follow-up). This type of data is often too sparse for traditional time-series analysis but contains richer temporal information than a simple cross-sectional dataset. The Cross-Lagged Panel Network (CLPN) model, introduced by Wysocki et al. (2025), is a powerful tool specifically designed to fill this methodological gap (see Figure 4 for an example).
Unlike traditional cross-lagged panel models that focus on latent variables, the CLPN model operates at the level of individual items. It models the direct, predictive relationships between each variable at one time point and every other variable at the subsequent time point. This item-level focus allows for the discovery of highly nuanced and specific longitudinal pathways. For example, a CLPN could reveal how a specific aspect of academic performance (e.g., “difficulty concentrating on homework”) predicts a specific feeling of low self-worth (e.g., “feeling useless”) at a later time, while other aspects of performance do not. This can help identify critical “bridge nodes” that link different psychological constructs over time, generating more precise and testable causal hypotheses. To estimate these potentially complex models, the authors propose a two-step regularized structural equation modeling (l₁-SEM) approach, which simulations show is effective at recovering the true network structure, especially when the relationships are non-stationary (i.e., the strength of connections changes across different measurement occasions).
Figure 4
CLPN Estimated Using the Hybrid L1-SEM Approach in Wysocki et al. (2025)

How Do We Model Person-Specific Change with Moderated Idiographic Networks?
While group-level models provide valuable information about general psychological principles, the ultimate goal of clinical science is often to understand and help a specific individual. Idiographic (person-specific) network models, typically based on vector autoregressive (VAR) models, are a major step in this direction. However, they traditionally assume that an individual’s psychological system is stable over time. The moderated time-series model introduced by Bringmann et al. (2024) moves beyond this assumption to answer a critical question: why does an individual’s psychological system change?
This approach extends the idiographic VAR model by allowing external variables, or moderators, to influence the network’s parameters over time (see Figure 5). This enables researchers and clinicians to formally test how specific contexts or events alter the dynamics of a person’s symptom network. For example, one could test how an individual’s sleep quality (a continuous moderator) on a given night changes the strength of the connection between their feelings of anxiety and sadness the next day. Similarly, one could model a clinical intervention (a binary moderator) to see precisely which symptom-to-symptom pathways it strengthens or weakens. This methodology represents a significant leap towards the promise of truly personalized mental healthcare. It provides a formal, quantitative framework for moving beyond the question “Does this therapy work on average?” to ask “How, when, and for whom does this therapy alter the specific dynamics of their psychological distress?” To facilitate this work, the authors provide a new R function, mod_mlvar, which uses a two-step Bayesian approach to estimate these complex, moderated person-specific networks.
Figure 5
This path diagram represents the state space representation of a VAR model with two variables, y1,t and y2,t. Panel A illustrates the direct modeling of the time-varying means (µ1,t and µ2,t) instead of requiring inference from intercepts. Additionally, panel A highlights two distinct equations: the measurement equation, which models the observable process (y1,t and y2,t), and the state or transition equation, which models the latent process (η1,t and η2,t) following a VAR model. Panel B illustrates how the time-varying parameters depend on a moderator variable (i.e., the fixed moderator variable, xt). Furthermore, it shows that all moderated parameters have an intercept when being modelled (i.e., constant of 1). For example µ1,t = µ1+ βµ,1xt where µ1,t has the intercept µ1. From Bringmann et al. (2024).

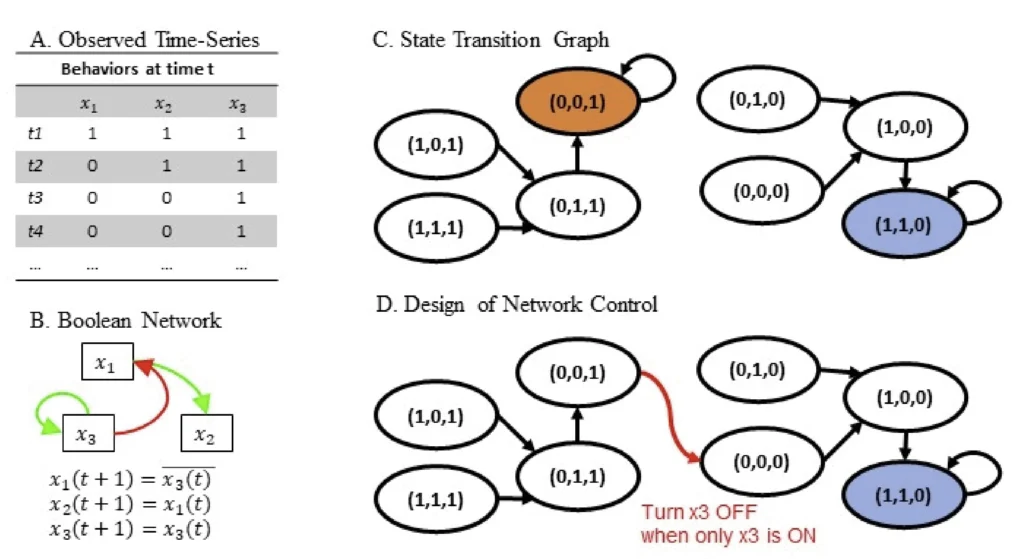
How Can We Model Group Dynamics Beyond Simple Social Influence?
Understanding and managing behavior change in small groups—such as therapy groups, work teams, or families—is a central challenge in many areas of psychology. Many models of social influence assume that interactions are purely assimilative, meaning that individuals tend to become more similar to one another over time. The Boolean network method, proposed for this context by Yang et al. (2024), offers a more flexible and nuanced approach that can capture the complex realities of group dynamics (see Figure 6 for a conceptual example).
A key advantage of the Boolean network method is its ability to simultaneously model both assimilative and repulsive social influence within the same group. Repulsive influence occurs when one person’s behavior causes another to act in an opposite manner. The model represents each group member’s behavior as a binary state (e.g., self-disclosing or not) and uses Boolean functions to map how each person’s state at one time point influences every other member’s state at the next. This allows for a detailed, group-specific map of social influence dynamics.
When applied to empirical data on self-disclosure in therapy groups, the method revealed that 16 out of 18 groups exhibited both assimilative and repulsive influences, demonstrating that this complexity is not just theoretical but present in real-world data. Furthermore, the model can be used to identify group-specific “control strategies”—that is, targeted interventions aimed at specific members to steer the entire group towards a desired state (e.g., widespread self-disclosure). This suggests that effective group management may depend less on generic principles and more on identifying and leveraging the unique, complex dynamics of each specific group.
Figure 6
Example of a three-node network Boolean network, consisting of x1, x2, x3, presented in Yang et al. (2024).
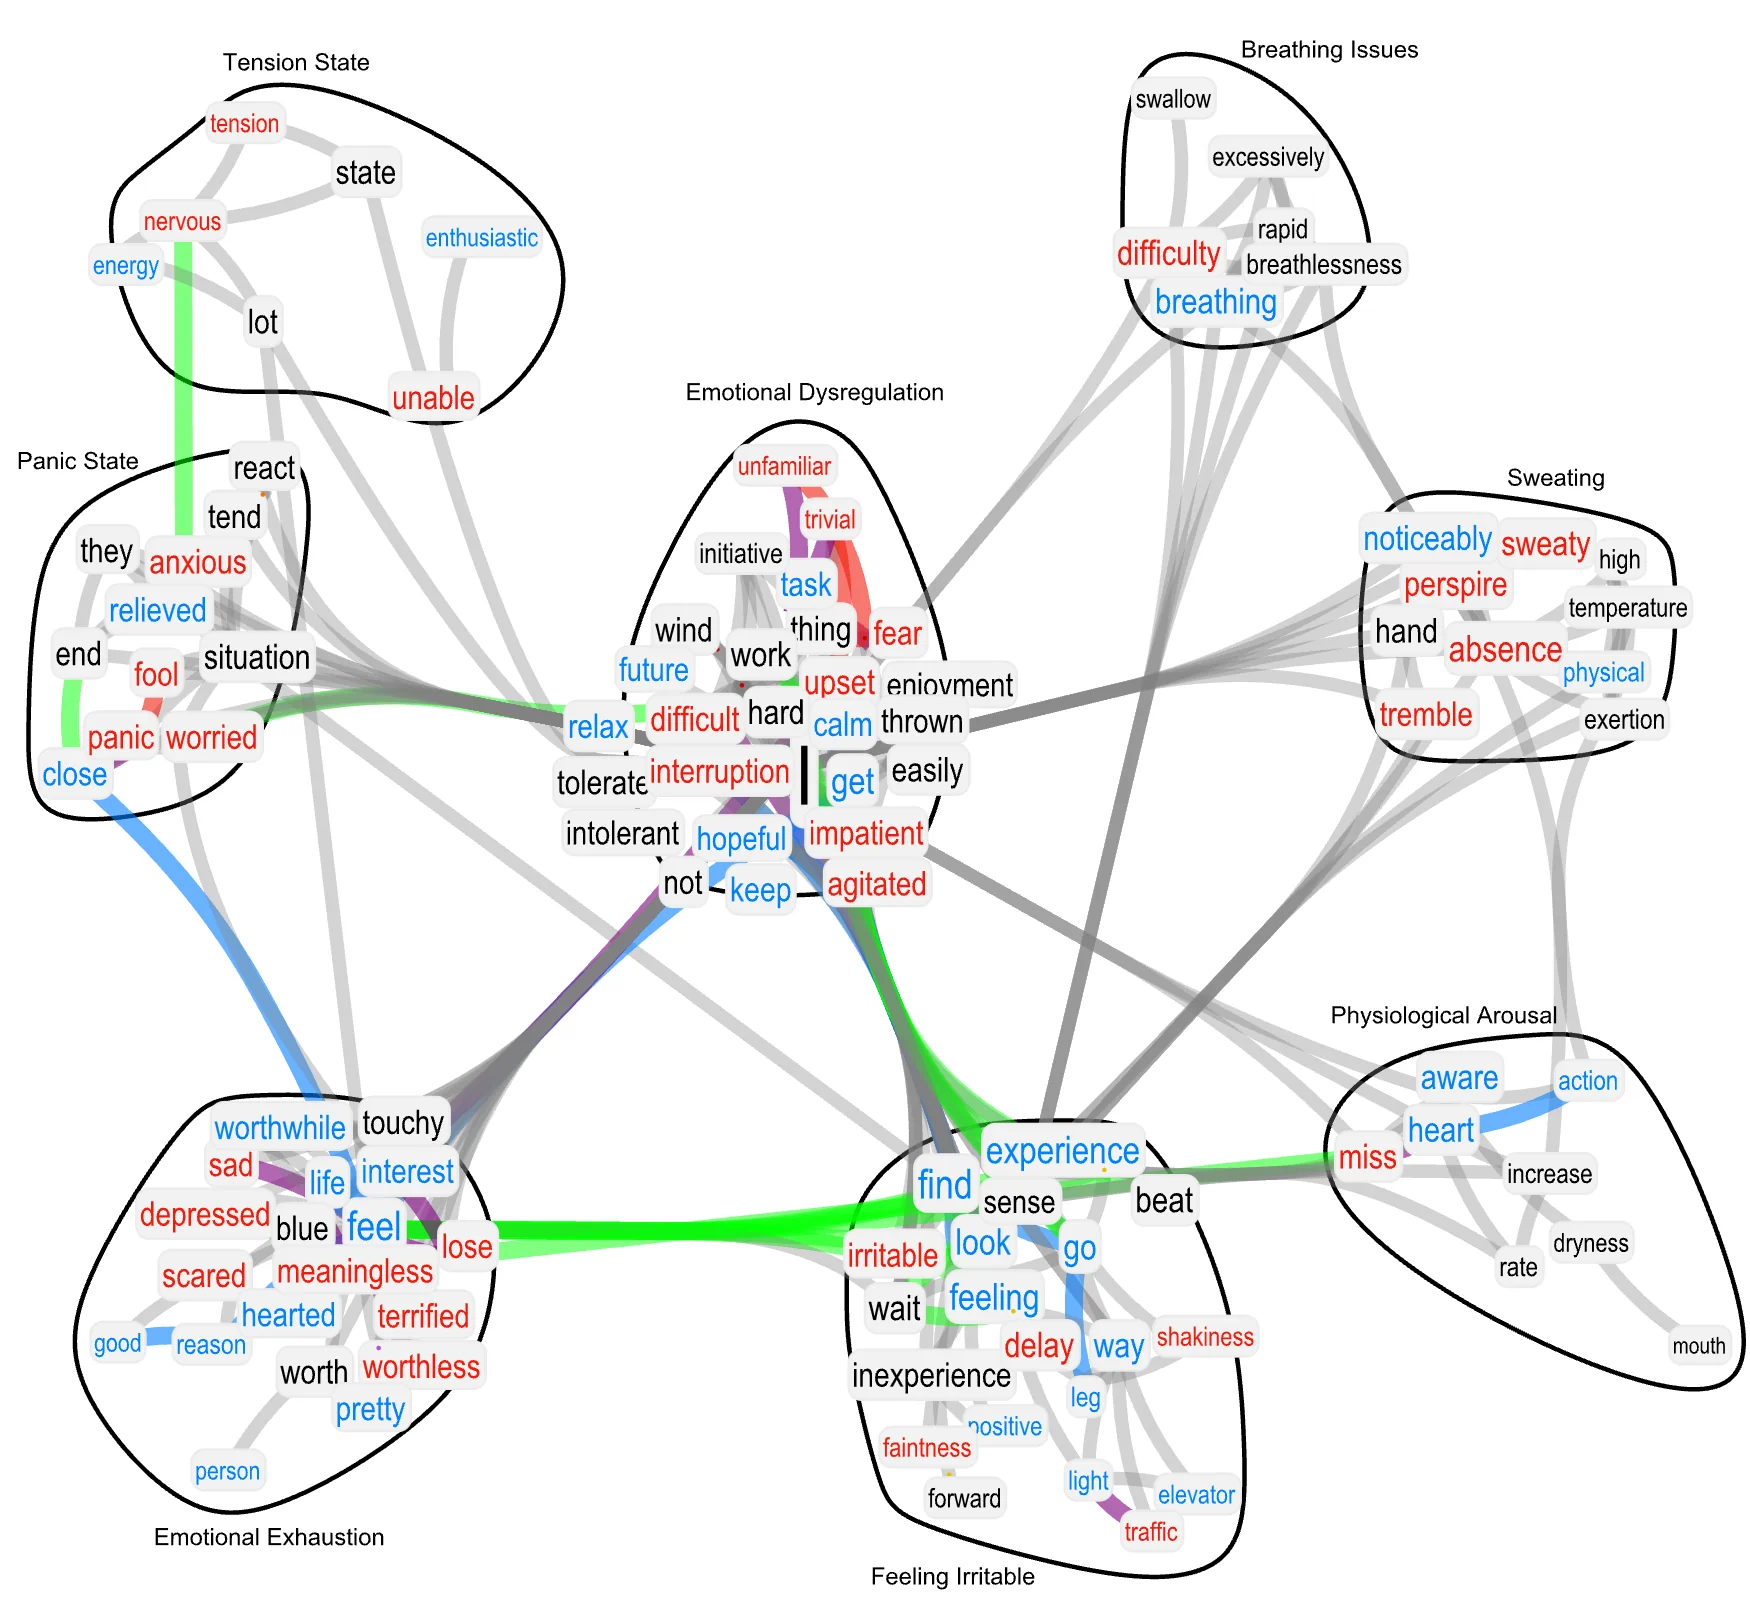
How Does the Meaning of Words Relate to Psychological Structures?
Psychometric scales are the bedrock of psychological measurement, but why do items on these scales cluster into statistical factors in the way they do? An innovative line of research by Stanghellini et al. (2024) bridges cognitive network science with network psychometrics to provide a compelling answer. Their work suggests that the statistical structures we observe in psychological data are deeply grounded in the shared semantic and conceptual networks that people use to understand the meaning of the items themselves.
The study introduces a novel metric called “semantic loadings.” First, a cognitive network is constructed from the text of the psychometric items, representing the semantic and syntactic relationships between the words used. Then, this semantic structure is compared to the psychometric factor structure that emerges from how thousands of participants actually respond to the items. The semantic loadings quantify the degree of overlap between these two structures.
Applying this method to the Depression, Anxiety, and Stress Scale (DASS-21), the researchers found a significant, non-random quantitative match (see Figure 7). For example, items that were semantically related to concepts like “sweating,” “breathing issues,” and “physiological arousal” loaded specifically and significantly onto the psychometric factor representing the physical symptoms of anxiety. This provides a potential mechanism for why psychometric factors form: the act of reading and responding to an item activates a network of related concepts in a person’s mind, and this shared cognitive activation across individuals is what gives rise to the statistical correlations that psychometric methods detect. This suggests that we might one day be able to predict or better understand the factor structure of a scale simply by analyzing the semantic content of its items, a development that could reinvent scale construction and cross-cultural adaptation.
Figure 7
Textual Forma Mentis Network (TFMN) Representing Syntactic/Semantic Associations Between Concepts as Expressed in the DASS Items in Stanghellini et al. (2024). Nodes are highlighted in red (cyan, black) if perceived with negative (positive, neutral) valence by participants in a psychological mega-study (cf. Stella (2020)). Syntactic links between positive (negative, neutral) words are in cyan (red, grey). Syntactic links between a positive and a negative word are in purple. Green links indicate synonyms. Words are clustered in communities as obtained from the Louvain method.
A Practical Guide to Bayesian Network Estimation
The Bayesian paradigm has become increasingly central to network psychometrics, offering a powerful and flexible framework for statistical inference. Unlike frequentist approaches that yield point estimates and confidence intervals, Bayesian methods provide a full probability distribution for each parameter, allowing for a more intuitive and comprehensive quantification of uncertainty. This section consolidates recent developments in Bayesian network estimation, providing a practical guide to a generalized modeling framework, the critical role of prior specification, specific advice for binary data, and a user-friendly software package designed to make these advanced methods accessible to all researchers.
What is a Generalized Framework for Bayesian Gaussian Graphical Models (BGGMs)?
While several packages exist for estimating Bayesian Gaussian Graphical Models (BGGMs), many are built on different modeling principles, making them inflexible and difficult to extend or combine. To address this limitation, Franco et al. (2024) introduced a new, generalized approach that enhances the flexibility and applicability of BGGMs.
The core of this new method involves a transformation of the Cholesky decomposition of the covariance matrix. This technical innovation allows for much greater flexibility in specifying the priors (the initial beliefs about the parameters) and the likelihoods (the model for the data). A key practical advantage of this framework is its ability to estimate regularized partial correlations between diverse data types within the same model. Researchers can now seamlessly model networks containing continuous, binary, and ordinal variables simultaneously, a feature that greatly expands the range of research questions that can be addressed. To implement this flexible approach, the authors have developed the gbggm R package, providing a practical tool for applied researchers.
Why is the Choice of Priors So Critical for Bayesian Inference?
A defining feature of Bayesian analysis is the specification of prior distributions, which represent the researcher’s knowledge or uncertainty about a parameter before observing the data. While this allows for the formal incorporation of existing theory, it also introduces a degree of subjectivity. A sensitivity analysis by Sekulovski et al. (2024) serves as a crucial guide for applied researchers, demonstrating that the choice of priors can have a profound impact on the final conclusions.
The study focused on the edge inclusion Bayes factor, a key metric used to quantify the evidence for the presence versus the absence of an edge in the network. The results show that this Bayes factor is highly sensitive to the prior distributions placed on both the network structure (i.e., how dense the network is expected to be) and the network parameters (i.e., the strength of the partial correlations). In particular, the scale of the prior distribution on the partial correlations was found to be a critical parameter. Even small variations in this prior can substantially alter the evidence, potentially leading a researcher to conclude that an edge exists when the evidence is weak, or vice-versa. To help researchers make more informed, evidence-based decisions, the authors provide an interactive Shiny app that allows users to explore how different prior choices affect the Bayes factor, promoting more robust and transparent research practices (see Figure 8).
Figure 8
Screenshot of the Shiny app setup of simBgms in Sekulovski et al. (2024).

How Should We Estimate Networks for Binary Data? A Comparison of Estimators for the Ising Model
When working with binary data (e.g., yes/no symptom endorsements), the appropriate network model is the Ising model. Estimating the parameters of the Ising model is statistically challenging. The gold standard method, exact Maximum Likelihood (ML) estimation, is computationally intensive and becomes infeasible for all but the smallest networks (fewer than ~10 nodes). Consequently, researchers must rely on approximation methods. A study by Keetelaar et al. (2024) provides clear, practical guidance by comparing the performance of the two most popular approximation methods: Maximum Joint Pseudolikelihood Estimation (MJPLE) and Maximum Disjoint Pseudolikelihood Estimation (MDPLE).
The extensive simulation study revealed clear differences in performance. MJPLE emerged as a stable and accurate estimation method that closely approximates the ML estimates across a wide range of conditions. In contrast, MDPLE was found to have a much larger bias in small samples and only performs well when sample sizes are large. When sample sizes are large enough for both methods to be viable, the choice depends on the expected network structure: MDPLE is more efficient for sparse networks (few connections), while MJPLE performs better for dense networks (many connections). This provides a clear decision heuristic for applied researchers working with binary data.
How Can We Make Bayesian Analysis Accessible?
The power and flexibility of Bayesian methods can come with a steep learning curve. The existence of multiple specialized R packages, each with its own syntax and output format, can be a significant barrier for applied researchers who are not statistical experts. The easybgm R package, introduced by Huth et al. (2024), was created specifically to solve this problem.
easybgm functions as a unified, user-friendly “front-end” for several powerful but complex backend packages, including bgms and BDgraph. It streamlines the entire analytical workflow into a few simple commands. With easybgm, a researcher can fit a Bayesian graphical model to any type of cross-sectional data, extract the key results (such as the posterior distribution for each edge), and generate publication-ready visualizations—including network plots, edge evidence plots, and structure uncertainty plots—with minimal coding. The package also includes educational vignettes that guide users through the process of Bayesian analysis. The development of accessible software like easybgm marks a critical inflection point in the adoption of advanced methods. It signals the maturation of the Bayesian network paradigm from a niche, expert-only domain to a mainstream analytical tool, democratizing these methods and accelerating the pace of discovery across psychology.
| Table 1: Key R Packages for Advanced Network Psychometrics | |||
| Package Name | Core Functionality | Primary Application | Key Reference |
gbggm | Generalized Bayesian Gaussian Graphical Models | Estimating networks with mixed data types (continuous, binary, ordinal) using a flexible Cholesky decomposition approach. | Franco et al. (2024) |
simBgms | Simulation for Bayesian Graphical Models | Performing custom simulation studies for Bayesian Markov Random Field models to assess the impact of priors and other choices. | Sekulovski et al. (2024) |
mod_mlvar | Moderated Multilevel Vector Autoregression | Estimating person-specific (idiographic) time-series networks where connections can change depending on a moderator variable. | Bringmann et al. (2024) |
easybgm | Easy Bayesian Graphical Models | A user-friendly interface that unifies several complex Bayesian network packages for streamlined model fitting, results extraction, and plotting. | Huth et al. (2024) |
From Models to Meaning: Interpretation and Application
The ultimate value of any statistical model lies in its ability to provide meaningful insights into the phenomena it represents. As network psychometric methods become more sophisticated, it is crucial to develop clear principles for interpreting their output and applying them to solve real-world problems. This final section bridges the gap between complex statistical models and actionable psychological knowledge. It explores how network structures can be summarized to predict important outcomes and showcases how the network paradigm can be flexibly applied to novel domains, such as understanding the emotional dynamics of political communication.
How Can We Use Network Structure to Predict Psychological Outcomes?
A common goal in psychological research is to predict an external outcome variable, such as life satisfaction, academic performance, or treatment response. While a network model provides a rich, multivariate description of a psychological construct, its complexity can make it difficult to use as a predictor in a standard regression analysis. How can we distill the information from an entire network into a single, useful metric? An exploratory study by Johal and Rhemtulla (2024) provides a direct, empirical answer to this practical question.
The study compared the predictive utility of several different network-derived metrics using four intensive longitudinal datasets. The results showed that metrics based on the overall network structure—such as network density (the proportion of connections) or global strength (the sum of all edge weights)—were consistently poor predictors of psychological outcomes. This suggests that the overall complexity or interconnectedness of an individual’s psychological system may be less important for prediction than the behavior of its specific components.
By contrast, the most consistent and effective predictor was an individual’s average score on the node that was identified as the most frequently central node across the entire sample (see Table 1). This provides a clear and parsimonious recommendation for researchers. Instead of getting lost in the complexity of the full network, researchers can use network analysis as a sophisticated form of variable selection. The analysis identifies the single most critical component of the system, and the activation level of that component can then be used as a powerful summary variable for predicting external outcomes.
Table 1
Regression results for network structure variables in Johal and Rhemtulla (2024)

What Can Networks Reveal About Emotional Dynamics in Political Discourse?
The flexibility of the network paradigm allows it to be applied far beyond its origins in clinical symptom data. A compelling case study by Tomašević and Major (2024) demonstrates the utility of network methods for analyzing the complex, time-varying behavioral data inherent in political communication. This research provides a quantitative lens for understanding the structure and dynamics of emotions expressed by political leaders during speeches.
Using Dynamic Exploratory Graph Analysis (Dynamic EGA) on Facial Expression Recognition (FER) data coded from videos of political speeches, the study identified a two-dimensional network structure of emotional expression. This structure clearly separated positive emotions (like happiness and pride) from negative emotions (like fear and anger), revealing how they co-occur and change over time. The analysis uncovered a striking difference between leaders with varying degrees of populist rhetoric. For more populist leaders, the expression of anger was more autonomous and less connected to other emotions in the network. In contrast, for these same leaders, the expression of happiness became more contingent and dependent on the expression of other positive emotions (see Figure 9).
This study serves as a powerful illustration of the network approach’s potential. It can act as a “microscope” to reveal the hidden structural patterns in complex behavioral streams, providing empirical, quantitative evidence for theories in political psychology and communication studies. This opens up new avenues of research for applying network psychometrics to understand the affective underpinnings of social and political life.
Figure 9
Network representing affective dynamics of political speeches according to different levels of populist rhetoric (1: strong pluralists, 4: strong populists). Nodes represent basic emotions and edges represent partial correlations of FER scores. Thickness of the edge represents the strength of the correlations. Presented in Tomašević and Major (2024).

Frequently Asked Questions
What is the primary difference between a network model and a latent variable model?
A latent variable model assumes that observed variables (e.g., symptoms on a questionnaire) are indicators of a single, unobserved common cause (the latent variable). For example, feeling sad, losing interest, and having trouble sleeping are seen as caused by an underlying entity called “depression.” In contrast, a network model assumes that these observed variables directly influence each other. The psychological construct of “depression” is not a hidden cause but is the complex system of these interacting symptoms.
How does measurement error affect the structure of a psychological network?
Measurement error, or unreliability in how variables are measured, can significantly distort a network’s structure. According to research by Henry and Ye (2024), it tends to artificially inflate the strength of connections (edge weights) and the overall density of the network. This can make the psychological system appear more interconnected and resilient than it truly is, potentially leading to incorrect conclusions about which components are most influential.
Why are Bayesian methods often preferred for network psychometrics?
Bayesian methods are increasingly preferred for several reasons. They provide a more complete picture of uncertainty by estimating a full probability distribution for every parameter, rather than just a single point estimate. They allow researchers to formally incorporate prior knowledge into the model, which can lead to more stable and accurate estimates, especially with smaller sample sizes or complex models. Finally, Bayesian frameworks are highly flexible, enabling the development of advanced models that can handle diverse data types and complex research questions (Franco et al., 2024; Huth et al., 2024).
What is an idiographic network and how can it be used in clinical practice?
An idiographic network is a psychological network model that is estimated for a single individual, typically using intensive longitudinal data (e.g., daily diary entries). As demonstrated by Bringmann et al. (2024), these person-specific models can be used in clinical practice to understand a patient’s unique symptom dynamics. By incorporating moderators, a clinician can test how specific interventions (like therapy) or life events (like a change in sleep patterns) alter the connections within that individual’s symptom network over time, paving the way for truly personalized treatment plans.
Can network models be used to determine the causes of psychological symptoms?
This requires caution. Standard network models, which are based on partial correlations, are descriptive tools that show statistical associations; they are not suitable for making strong causal claims. Research by Park et al. (2024) shows that these models can contain spurious edges and do not adequately represent feedback loops. However, more specialized cyclic causal discovery methods can be used with observational data to generate plausible causal hypotheses about the reciprocal relationships between symptoms, which can then be tested in future experimental studies.
This knowledge hub was compiled by the editorial team of advances.in/psychology, based on peer-reviewed research from our contributing authors. Our mission is to advance the scientific understanding of the human mind and behavior. For more information about our journal and editorial standards, please visit our About page.
References
Bringmann, L. F., Ariens, S., Ernst, A. F., Snippe, E. & Ceulemans, E. (2024) .Changing networks: Moderated idiographic psychological networks. advances.in/psychology, 2, e658296. https://doi.org/10.56296/aip00014
Franco, V.R., Barros, G.W.G., & Jiménez, M. (2024). A generalized approach for Bayesian Gaussian graphical models. advances.in/psychology, 2, e533499. https://doi.org/10.56296/aip00022
Haslbeck, J., & Epskamp, S. (2024). Observed correlations between person-means depend on within-person correlations. advances.in/psychology, 2, e853425. https://doi.org/10.56296/aip00020
Henry, T. R., & Ye, A. (2024). The effects of omitted variables and measurement error on cross-sectional network psychometric models. advances.in/psychology, 2, e335225. https://doi.org/10.56296/aip00011
Huth, K.B.S., Keetelaar, S., Sekulovski, N., van den Bergh, D., & Marsman, M. (2024). Simplifying Bayesian analysis of graphical models for the social sciences with easybgm: A user-friendly R-package. e66366. https://doi.org/10.56296/aip00010
Johal, S. K. & Rhemtulla, M. (2024). Relating network-instantiated constructs to psychological variables through network-derived metrics: An exploratory study. advances.in/psychology, 2, e939409. https://doi.org/10.56296/aip00024
Keetelaar, S., Sekulovski, N., Borsboom, D., & Marsman, M. (2024).Comparing maximum likelihood and maximum pseudolikelihood estimators for the Ising model. advances.in/psychology, 2, e25745. https://doi.org/10.56296/aip00013
Park, K., Waldorp, L. J., & Ryan, O. (2024). Discovering cyclic causal models in psychological research. advances.in/psychology, 2, e72425. https://doi.org/10.56296/aip00012
Sekulovski, N., Keetelaar, S., Haslbeck, J., & Marsman, M. (2024). Sensitivity analysis of prior distributions in Bayesian graphical modeling: Guiding informed prior choices for conditional independence testing. advances.in/psychology, 2, e92355. https://doi.org/10.56296/aip00016
Stanghellini, F., Perinelli, E., Lombardi, L., & Stella, M. (2024). Introducing semantic loadings in factor analysis: Bridging network psychometrics and cognitive networks for understanding depression, anxiety and stress. advances.in/psychology, 2, e35366. https://doi.org/10.56296/aip00008
Tomašević, A. & Major, S. (2024). Dynamic exploratory graph analysis of emotions in politics. advances.in/psychology, 2, e312144. https://doi.org/10.56296/aip00021
Wysocki, A., McCarthy, I., van Bork, R., Cramer, A.O.J, & Rhemtulla, M. (2025). Cross-lagged panel networks. advances.in/psychology, 2, e739621. https://doi.org/10.56296/aip00037
Yang, X., Albert, R., Molloy, L.E., & Ram, N. (2024). Modeling and managing behavior change in groups: A Boolean network method. advances.in/psychology, 2, e55226. https://doi.org/10.56296/aip00009