

Abstract
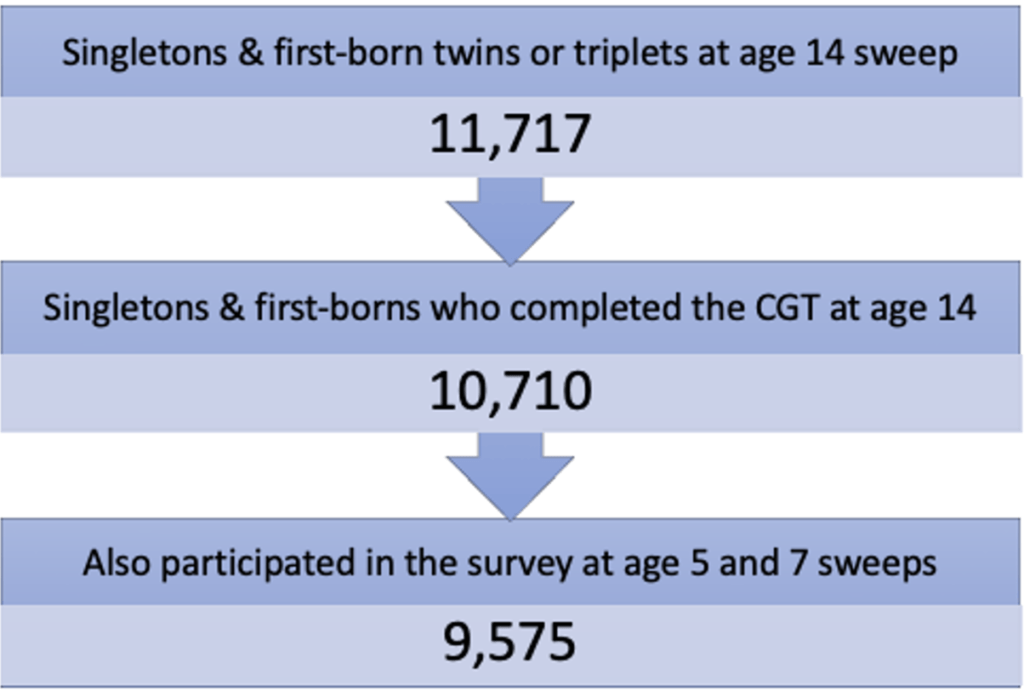
We examined the role of a crucial component of Theory of Mind in childhood, namely the attribution of false beliefs to other agents, in the ability to adjust risk-taking strategies during decision-making in adolescence. The analytic sample was 9575 children from the UK's Millennium Cohort Study, followed at ages 5, 7, and 14 years. The ability to attribute false beliefs was measured at ages 5 and 7 years through a vignette version of the Sally-Anne Task administered by an unfamiliar assessor in a socially demanding dyadic interaction. Risk adjustment was measured at age 14 years with the Cambridge Gambling Task. Even after controlling for a range of individual and family factors, such as sex, ethnicity, verbal ability, family income, and parental education, as well as emotional and behavioural problems, we found that social cognitive abilities in childhood are positively associated with risk adjustment in decision-making during adolescence.
Editor Curated
Key Takeaways
- In a large-scale study of 9,575 adolescents from the UK Millennium Cohort Study, children who demonstrated superior social cognition (Theory of Mind) at ages 5 and 7 scored significantly higher on Risk Adjustment tasks at age 14.
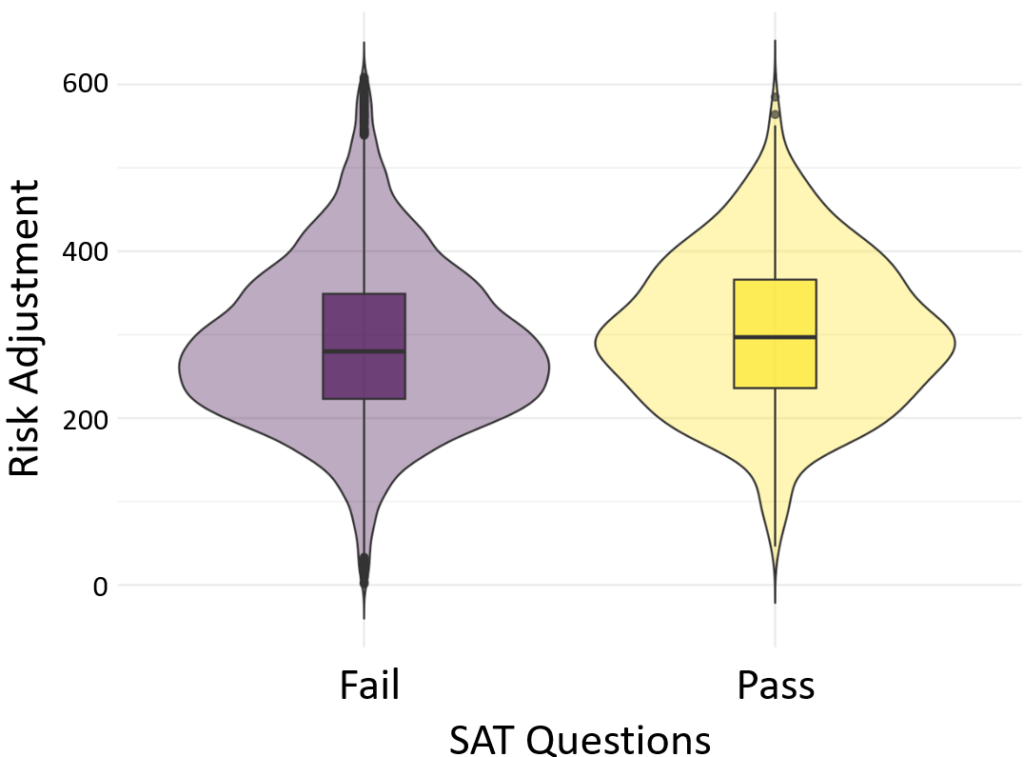
- Supporting the Social-Motivational Flexibility Model, the data shows that early social skills specifically predict the ability to adjust strategies based on feedback (p < .014), but do not statistically significantly predict overall impulsive Risk Taking (p > .05), suggesting a link to cognitive flexibility rather than inhibition2222.
- The positive association between childhood social cognition and adolescent decision-making persisted (b = 10.46) even after controlling for family income, maternal education, and verbal ability, with the effect size being comparable to vocabulary knowledge.
Keywords: